. 2009 Mar 20;30(3):358-71.
doi: 10.1016/j.immuni.2009.02.003. Epub 2009 Mar 12.

An essential role of the Forkhead-box transcription factor Foxo1 in control of T cell homeostasis and tolerance

Affiliations

An essential role of the Forkhead-box transcription factor Foxo1 in control of T cell homeostasis and tolerance

Weiming Ouyang et al. Immunity. .

Abstract

Members of the Forkhead box O (Foxo) family of transcription factors are key regulators of cellular responses, but their function in the immune system remains incompletely understood. Here we showed that T cell-specific deletion of Foxo1 gene in mice led to spontaneous T cell activation, effector T cell differentiation, autoantibody production, and the induction of inflammatory bowel disease in a transfer model. In addition, Foxo1 was critical for the maintenance of naive T cells in the peripheral lymphoid organs. Transcriptome analyses of T cells identified Foxo1-regulated genes encoding, among others, cell-surface molecules, signaling proteins, and nuclear factors that control gene expression. Functional studies validated interleukin-7 receptor-alpha as a Foxo1 target gene essential for Foxo1 maintenance of naive T cells. These findings reveal crucial functions of Foxo1-dependent transcription in control of T cell homeostasis and tolerance.


Conflict of interest statement

Competing interest statement

The authors declare that they have no competing financial interests.

Figures

Figure 1
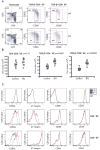
Figure 1. Generation of Mice with T Cell-specific Deletion of the Foxo1 Gene
(A) Schematic presentation of original allele (+), targeting vector, the recombinant allele, and the floxed allele (Foxo1). Filled boxes represent the first exon of Foxo1 gene. The locations of restriction-enzyme sites (Xb, XbaI) are indicated. Loxp and Frt sites are showed as arrowheads and filled circles respectively. (B) PCR genotyping of the Floxed Foxo1 allele and the original allele. (C) CD4+, CD8+ T cells and B cells were purified from WT (Foxo1/Foxo1) and KO (4Cre-Foxo1/Foxo1) mice by FACS sorting. The amounts of Foxo1 and p38 were determined by immunoblotting. p38 was used as a loading control.
Figure 2
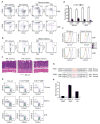
Figure 2. T Cell Development in Foxo1-deficient Mice
(A) Thymic CD4 and CD8 profile of WT and KO mice at 6 weeks old. CD69 and CD62L were used as maturation makers for TCR-βhiCD4+ and TCR-βhiCD8+ single positive (SP) thymocytes. These are representative results of eight mice per group analyzed. (B) Number of thymic CD4+CD8+ (double positive, DP), TCR-βhiCD4+ SP and TCR-βhiCD8+ SP cells in control (Foxo1/Foxo1) and KO (4Cre-Foxo1/Foxo1) mice (n=8) at 6–8 weeks old. The p values between two groups of T cell number are shown. (C) Expression of CD62L, β7 integrin, CD69 and CD24 in thymocytes from WT and KO mice at 6 weeks old. These are representative results of four mice per group analyzed.
Figure 3
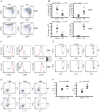
Figure 3. T Cell Activation and Differentiation in Foxo1-deficient Mice
(A) Expression of CD44 and CD62L in splenic CD4+ and CD8+ T cells from WT and KO mice at 6 weeks old. These are representative results of six independent experiments. (B) The number of splenic CD4+ and CD8+ naïve (CD44loCD62Lhi) and activated (CD44hiCD62Llo) T cells from control (Foxo1/Foxo1) and KO mice (n=6) at 6–8 weeks old. The p values between two groups of T cell number are shown. (C) Expression of CD62L, CD69, and CD122 in splenic CD4+ and CD8+ T cells from WT and KO mice at 6 weeks old. These are representative results of six mice per group analyzed. (D) The percentage of thymic, splenic, and peripheral lymph node (pLN) CD4+Foxp3+ regulatory T (Treg) cells in WT and KO mice at 6 weeks old. These are representative results of six mice per group analyzed. (E) CD4+ and CD8+ T cells isolated from the spleens of WT and KO mice were stimulated with PMA and ionomycin for 4 hr and analyzed for the expression of IFN-γ, IL-4, IL-10, and IL-17 by intracellular cytokine staining. These are representative results of two independent experiments. (F) Titers of nuclear antibody (NA) and dsDNA antibody (DA) in the sera of control (Foxo1/Foxo1) and KO mice aged between 5 and 6 months (n = 6). The p values between the two groups of antibody titers are shown.
Figure 4
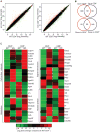
Figure 4. Differential Gene Expression between Wild-type and Foxo1-deficient Naïve T Cells
(A) Comparison of gene expression values between WT and KO naïve CD4+ and CD8+ T cells. (B) Overlapping of Foxo1-regulated genes in naïve CD4+ and CD8+ T cells. Genes with expression values equal or more than 2-fold different between WT and KO T cells are considered significant. The numbers of shared or uniquely regulated genes between CD4+ and CD8+ T cells are indicated. (C) A sublist of co-regulated genes between CD4+ and CD8+ T cells. The genes are grouped as cell surface molecules, signaling proteins, nuclear factors, and molecules involved in cell metabolism.
Figure 5
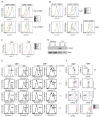
Figure 5. Defective IL-7R Expression and IL-7 Signaling in Foxo1-deficient T Cells
(A) Expression of CD127 (IL-7R) in TCR-βhiCD4+ and TCR-βhiCD8+ T cells from WT and KO mice at 6 weeks old. CD69+CD62Llo or CD69CD62Lhi T cells represent immature and mature populations respectively. ISC stands for the iso-type control antibody. These are representative results of five independent experiments. (B) Expression of CD127 in splenic CD4+ and CD8+ T cells from WT and KO mice at 6 weeks old. CD44loCD62Lhi, CD44hiCD62Llo or CD44hiCD62Lhi T cells represent naïve, effecor and central memory subsets respectively. These are representative results of five independent experiments. (C) Expression of Bcl-2 in splenic CD4+ and CD8+ naïve T cells from WT and KO mice at 8 weeks old. Intracellular staining was performed following the instructions of the manufacturer. (D) Naïve CD4+ T cells from WT and KO mice were left untreated (medium) or treated with 10 ng/ml IL-7 for 20 min. The amounts of phosphorylated Stat5 and total Stat5 protein was determined by immunoblotting. (E) Naïve CD4+ and CD8+ T cells from WT and KO mice were cultured in the absence or presence of increasing doses of IL-7 for 24 hr. Cell apoptosis was examined by Annexin-V staining. (F) Naïve CD4+ and CD8+ T cells isolated from KO (CD45.2) and the congenic WT (CD45.1) mice were labeled with CFSE, and co-transferred into Rag1-deficient mice. The percentage of WT and KO T cells before (d0) and after transfer (d7) was shown. CFSE dilution indicates cell proliferation. The histograms showed homeostatic proliferation of the transferred T cells. These are representative results of three independent experiments.
Figure 6
Figure 6. An Cell-intrinsic Role for Foxo1 in Control of IL-7R Expression
(A–F) Chimeras were generated by reconstitution of Rag1−/− recipients with WT (CD45.1), KO (CD45.2), or 1:1 mixed WT and KO bone marrow cells. The chimeric mice were analyzed 8 weeks after the bone marrow transfer. These are representative results of three independent experiments. (A) Expression of CD44 and CD62L in splenic CD4+ and CD8+ T cells from WT, KO or mixed chimeras. (B) Percentage of CD4+Foxp3+ regulatory T cells in the spleens of WT, KO or mixed chimeras. (C) Development of inflammatory bowel disease in KO chimeric mice. Hematoxylin and eosin staining of the colons of WT, KO or mixed chimeric mice. These are representative results of four mice per group analyzed. (D) Percentage of WT (CD45.1+) and KO (CD45.2+) T cells in the thymus, spleen and peripheral lymph nodes (pLN) of a mixed chimeric mouse. (E) Percentage of WT and KO T cells in the spleens and pLNs of the mixed chimeras that are normalized to thymic T cells (n=8). The p values of percentage between the two groups of mice are less than 10−7. (F) Expression of CD127 (IL-7R) in splenic naïve (CD44loCD62Lhi) CD4+ and CD8+ T cells from WT, KO or mixed chimeras. Expression of CD127 in T cells from WT and KO chimeras was plotted (left). Expression of CD127 in WT and KO T cell populations from the same mixed chimeric mouse was plotted (right). ISC stands for the iso-type control antibody. (G) Alignment of the conserved Foxo1-binding sites (FBS) in mouse and human Il7r gene promoter regions. The consensus Foxo1-binding sequences were marked. The nucleotide numbers are in reference to the translation start site (ATG, A is +1). Asterisks show the conserved nucleotides. (H) Chromatin immunoprecipitation analysis of Foxo1 binding to the mouse Il7r promoter region. Immunoprecipates from T cells were analyzed by quantitative PCR. The results were presented as fold of template enrichment in immunoprecipitates of Foxo1 antibody relative to those of an isotype control antibody (mean and s.d. of triplicate immunoprecipitations).
Figure 7
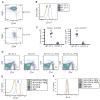
Figure 7. Foxo1 Control of IL-7R Expression and Homeostasis of OT-II T Cells
(A) Expression of CD44 and CD62L in splenic OT-II T cells from WT and KO mice at 8 weeks old. These are representative results of three independent experiments. (B) Expression of CD127 (IL-7R) in splenic OT-II T cells from WT and KO mice. These are representative results of three independent experiments. ISC stands for the iso-type control antibody. (C) Number of splenic and lymph node (pLN) OT-II T cells from WT and KO mice aged between 8 and 12 weeks. The p values of cell number between the two groups of mice are shown. (D) Percentage of splenic OT-II T cells from WT, KO, WT IL-7R transgenic (IL-7RTg), and KO IL-7RTg mice at 8 weeks old. These are representative results of three independent experiments. (E) CD127 expression in splenic OT-II T cells from WT, KO, WT IL-7RTg, and KO IL-7RTg mice at 8 weeks old. ISC stands for the iso-type control antibody. (F) Bcl-2 expression in splenic OT-II T cells from WT, KO, WT IL-7RTg, and KO IL-7RTg mice at 8 weeks old.

Similar articles

Cited by

References

    1. Akashi K, Kondo M, von Freeden-Jeffry U, Murray R, Weissman IL. Bcl-2 rescues T lymphopoiesis in interleukin-7 receptor-deficient mice. Cell. 1997;89:1033–1041. - PubMed
    1. Barata JT, Cardoso AA, Nadler LM, Boussiotis VA. Interleukin-7 promotes survival and cell cycle progression of T-cell acute lymphoblastic leukemia cells by down-regulating the cyclin-dependent kinase inhibitor p27(kip1) Blood. 2001;98:1524–1531. - PubMed
    1. Bayer AL, Lee JY, de la Barrera A, Surh CD, Malek TR. A function for IL-7R for CD4+CD25+Foxp3+ T regulatory cells. J Immunol. 2008;181:225–234. - PMC - PubMed
    1. Brunet A, Bonni A, Zigmond MJ, Lin MZ, Juo P, Hu LS, Anderson MJ, Arden KC, Blenis J, Greenberg ME. Akt promotes cell survival by phosphorylating and inhibiting a Forkhead transcription factor. Cell. 1999;96:857–868. - PubMed
    1. Burgering BM. A brief introduction to FOXOlogy. Oncogene. 2008;27:2258–2262. - PubMed

Publication types