. 2009 Mar 12;61(5):681-91.
doi: 10.1016/j.neuron.2009.01.026.

Lesion mapping of cognitive abilities linked to intelligence

Affiliations

Lesion mapping of cognitive abilities linked to intelligence

Jan Gläscher et al. Neuron. .

Abstract

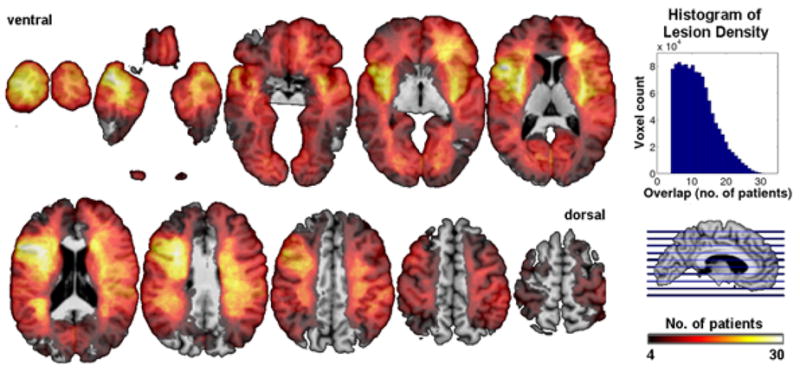
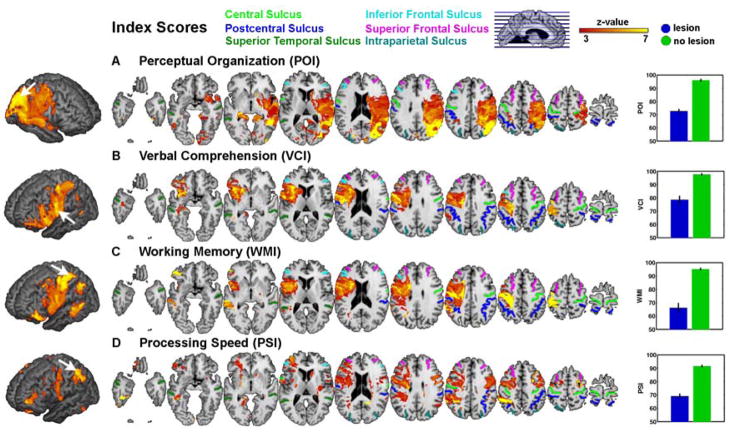
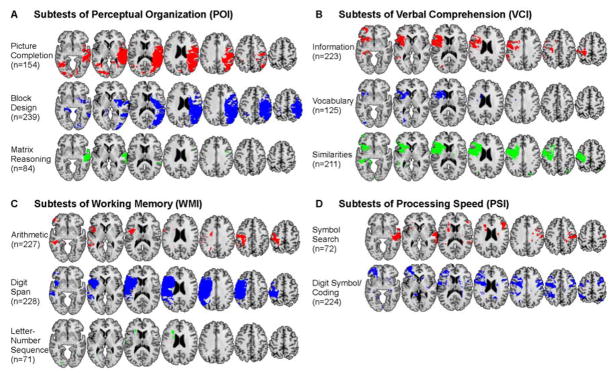
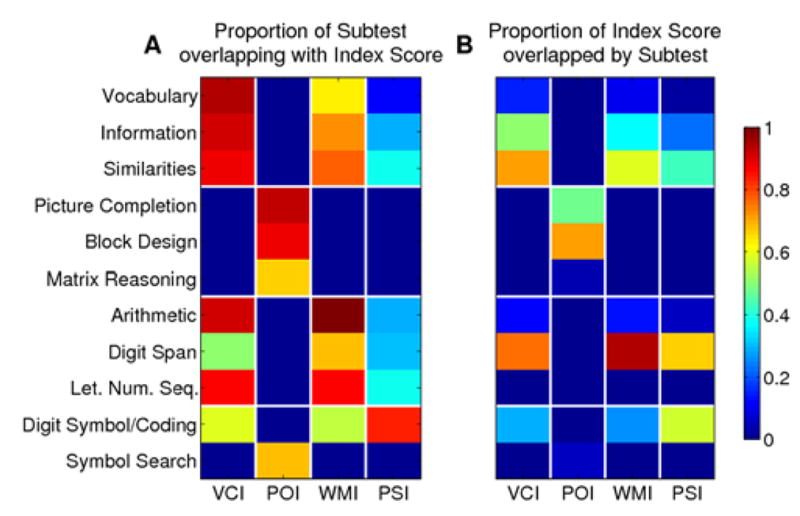
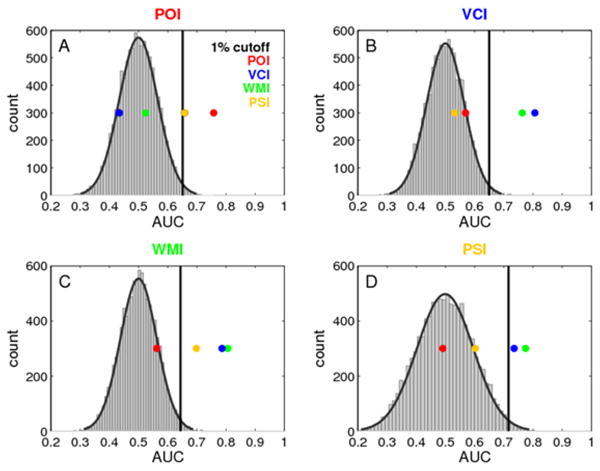
The Wechsler Adult Intelligence Scale (WAIS) assesses a wide range of cognitive abilities and impairments. Factor analyses have documented four underlying indices that jointly comprise intelligence as assessed with the WAIS: verbal comprehension (VCI), perceptual organization (POI), working memory (WMI), and processing speed (PSI). We used nonparametric voxel-based lesion-symptom mapping in 241 patients with focal brain damage to investigate their neural underpinnings. Statistically significant lesion-deficit relationships were found in left inferior frontal cortex for VCI, in left frontal and parietal cortex for WMI, and in right parietal cortex for POI. There was no reliable single localization for PSI. Statistical power maps and cross-validation analyses quantified specificity and sensitivity of the index scores in predicting lesion locations. Our findings provide comprehensive lesion maps of intelligence factors, and make specific recommendations for interpretation and application of the WAIS to the study of intelligence in health and disease.


Figures

Figure 1
Figure 1
Lesion density overlap map for all 241 patients. We restricted all analyses to a minimum overlap of 4 patients in a given voxel. The maximum overlap of 33 patients occurred in the left inferior frontal cortex. Horizontal cuts encode lesion overlap density by color.
Figure 2
Figure 2
Voxel-based lesion symptom mapping of four cognitive indices of intelligence. Our VLSM analyses compared the index scores for patients with a lesion against those without a lesion, at each and every voxel. All colored regions in the slice-wise display and the 3D projection (left; search depth 8 mm) survived a statistical threshold of 1% FDR. The size of the effect (greater Z-values) is color-coded with warmer colors corresponding to a greater difference. The graphs on the right show the mean difference on each index score between those patients whose lesions included the voxel showing the maximum effect (black arrow on the 3D projection) and those whose lesions did not include it (errorbar = s.e.m.). (a) perceptual oranization (b) verbal comprehension, (c) working memory, (d) processing speed.
Figure 3
Figure 3
VLSM analyses for all subtests from the Wechsler Adult Intelligence Scale. Subtests are grouped within the same four cognitive indices shown in Figure 2, and with the same uniform statistical thresholds as in Figure 2 (1% FDR). Regions with significant lesion-deficit relationships are thresholded and shown in unique colors corresponding to each subtest.
Figure 4
Figure 4
Overlap of subtests with index scores. (A) Proportion of significant voxels of each subtest that overlap with each index score as calculated by NOVLP/NST (NOVLP = number of significant voxels in overlap, NST = number of significant voxels in subtest. (B) Proportion of significant voxels in index that are overlapped by each subtest as calculated by NOVLP/NI (NI = number of significant voxels for index score).
Figure 5
Figure 5
Specificity and sensitivity of the findings. Area under the ROC curve (AUC) is shown for each index score in a cross-validation analysis (four colored dots). The ROC was derived from each index score and an independent overlap measure for each patient with the rest of the sample in individual leave-one-out VLSM analyses. The empirical null distribution (gray histogram with Gaussian fit superimposed) was derived by 10000 permutations of the index scores. The 99th percentile of this distrbution was defined as the critical threshold for statistical significance. The colored dots indicate the AUC of the original ordering of index scores and overlap measures (the colored dot that corresponds to the title of each graph) (sensitivity) as well as the AUC of each other index score with the individual overlap measure (specificity).

References

    1. Abdi H. In: RV coefficient and congruence coefficient. In Encyclopedia of Measurement and Statistics. Salkind N, editor. Thousand Oak, CA: Sage; 2007.
    1. Adolphs R, Damasio H, Tranel D, Cooper G, Damasio AR. A role for somatosensory cortices in the visual recognition of emotion as revealed by three-dimensional lesion mapping. J Neurosci. 2000;20:2683–2690. - PMC - PubMed
    1. Bar-On R, Tranel D, Denburg NL, Bechara A. Exploring the neurological substrate of emotional and social intelligence. Brain. 2003;126:1790–1800. - PubMed
    1. Bates E, Wilson SM, Saygin AP, Dick F, Sereno MI, Knight RT, Dronkers NF. Voxel-based lesion-symptom mapping. Nat Neurosci. 2003;6:448–450. - PubMed
    1. Bornstein RA, Matarazzo JD. Wechsler VIQ versus PIQ differences in cerebral dysfunction: a literature review with emphasis on sex differences. J Clin Neuropsychol. 1982;4:319–334. - PubMed

Publication types

MeSH terms