. 2009 Apr;174(4):1544-52.
doi: 10.2353/ajpath.2009.080596. Epub 2009 Mar 12.

GLUT1 expression is increased in hepatocellular carcinoma and promotes tumorigenesis

Affiliations

GLUT1 expression is increased in hepatocellular carcinoma and promotes tumorigenesis

Thomas Amann et al. Am J Pathol. 2009 Apr.

Abstract

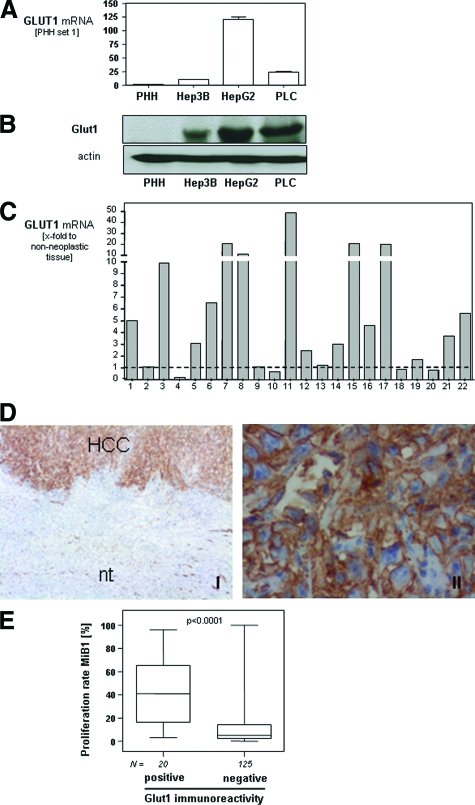
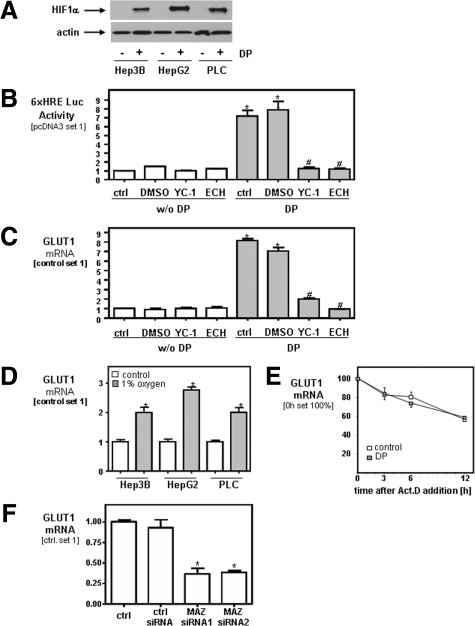
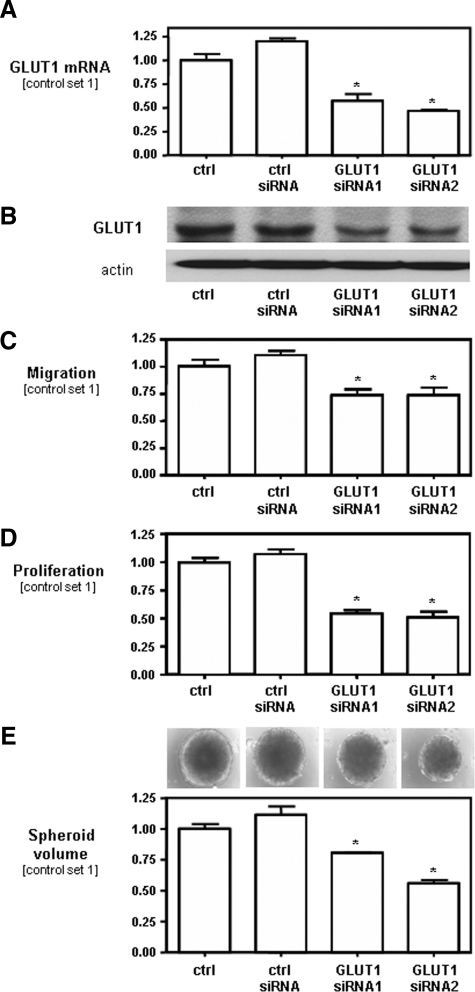
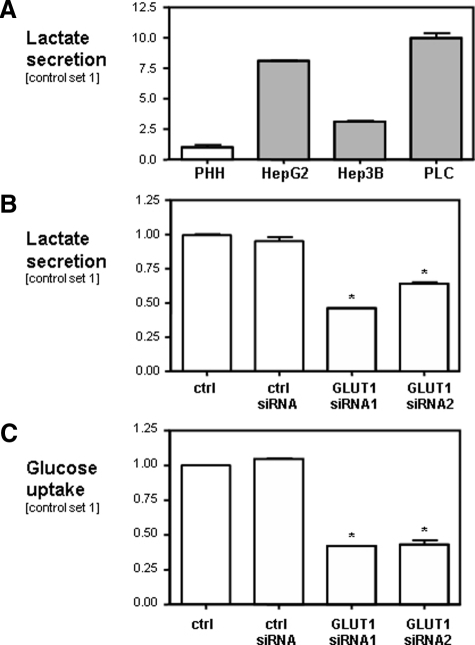
Accelerated glycolysis is one of the biochemical characteristics of cancer cells. The glucose transporter isoform 1 (GLUT1) gene encodes a key rate-limiting factor in glucose transport into cancer cells. However, its expression level and functional significance in hepatocellular cancer (HCC) are still disputed. Therefore, we aimed to analyze the expression and function of the GLUT1 gene in cases of HCC. We found significantly higher GLUT1 mRNA expression levels in HCC tissues and cell lines compared with primary human hepatocytes and matched nontumor tissue. Immunohistochemical analysis of a tissue microarray of 152 HCC cases revealed a significant correlation between Glut1 protein expression levels and a higher Ki-67 labeling index, advanced tumor stages, and poor differentiation. Accordingly, suppression of GLUT1 expression by siRNA significantly impaired both the growth and migratory potential of HCC cells. Furthermore, inhibition of GLUT1 expression reduced both glucose uptake and lactate secretion. Hypoxic conditions further increased GLUT1 expression levels in HCC cells, and this induction was dependent on the activation of the transcription factor hypoxia-inducible factor-1alpha. In summary, our findings suggest that increased GLUT1 expression levels in HCC cells functionally affect tumorigenicity, and thus, we propose GLUT1 as an innovative therapeutic target for this highly aggressive tumor.


Figures

Figure 1
Figure 1
GLUT1 expression in HCC. GLUT1 mRNA (A) and protein (B) expression in PHHs and three different HCC cell lines (HepG2, PLC, and Hep3B) analyzed by quantitative real-time PCR (A) and Western blotting (B). Data are given as mean ± SEM (*P < 0.05). C: GLUT1 mRNA expression in 22 human HCC samples in relation to matching nontumorous liver tissue samples. D: Glut1 immunohistochemical staining of human HCC tissue and adjacent nontumorous liver tissue (nt) and higher magnification of the same HCC tissue sample. E: Proliferation rate (analyzed by immunohistochemical staining applying anti-Ki-67 antibodies) in HCC-tissues with positive or negative immunoreactivity to Glut1 applying TMA technology. Original magnifications: ×40 (left); ×400 (right).
Figure 2
Figure 2
Regulation of GLUT1 expression in HCC under aerobic and anaerobic conditions. A: HIF-1α expression in three different HCC cell lines (HepG2, PLC, and Hep3B) with or without pharmacological induction of hypoxia by DP (100 μmol/L) analyzed by Western blotting. B: Luciferase activity in Hep3B cells transiently transfected with a reporter gene driven by six hypoxia-responsive elements (HREs) in relation to cells transfected with control plasmid (pcDNA3). DP (2,2′-dipyridy, 100 μmol/L), YC-1 (100 μmol/L); ECH (echinomycin, 10 nmol/L). * and #, P < 0.05 compared with control and DMSO without DP or with DP, respectively. C: GLUT1 mRNA expression in Hep3B cells with or without pharmacological induction of hypoxia or HIF-1α inhibition analyzed by quantitative real-time PCR. * and #, P < 0.05 compared with control and DMSO without DP or with DP, respectively. D: Analysis of GLUT1 mRNA expression in HCC cells cultured under normoxic conditions or 1% oxygen for 16 hours. *P < 0.05 compared with control. E: Hep3B cells were exposed to normoxic or hypoxic conditions, actinomycin D (Act.D, 7.5 μg/ml) was added, and incubation was continued for 3, 6, and 12 hours. GLUT1 mRNA was analyzed by qPCR. F: Analysis of GLUT1 mRNA expression in Hep3B cell transiently transfected with two different MAZ siRNAs (siRNA1 and siRNA2), and cells transfected with control siRNA and nontransfected HCC cells (ctrl.). *P < 0.05 compared with control. All experiments have been performed at least three times. Data are given as mean ± SEM.
Figure 3
Figure 3
Effect of GLUT1 inhibition on migration and proliferation of HCC cells. Analysis of GLUT1 (A) mRNA and (B) protein expression in Hep3B cells transiently transfected with two different GLUT1 siRNAs (siRNA1 and siRNA2), and cells transfected with control siRNA and nontransfected HCC cells (ctrl.). C: The migratory potential of these cells was assessed by Boyden chamber assays. D: For analysis of proliferation, cells were trypsinized and counted at different time points. Cell number at day 4 is set at 1. E: Growth in a three-dimensional cell culture system was assessed by analysis of the spheroid volume at day 14. All experiments have been performed at least three times. Data are given as mean ± SEM (*P < 0.05 compared with controls).
Figure 4
Figure 4
Effect of GLUT1 on rates of glucose uptake and glycolysis in HCC. Analysis of lactate secretion into the supernatant of PHHs and three different HCC cell lines (HepG2, PLC, and Hep3B) (A) and Hep3B cells transiently transfected with two different GLUT1 siRNAs (siRNA1 and siRNA2) (B), cells transfected with control siRNA and nontransfected HCC cells (ctrl.). C: Glucose uptake is reported as glucose utilization per cell within 24 hours. To that end, glucose concentration was measured in the supernatant and cells were counted 24 hours after seedings. All experiments have been performed at least three times. Data are given as mean ± SEM (*P < 0.05 compared with controls).

References

    1. El-Serag HB. Hepatocellular carcinoma: recent trends in the United States. Gastroenterology. 2004;127:S27–S34. - PubMed
    1. Farazi PA, DePinho RA. Hepatocellular carcinoma pathogenesis: from genes to environment. Nat Rev Cancer. 2006;6:674–687. - PubMed
    1. Bruix J, Boix L, Sala M, Llovet JM. Focus on hepatocellular carcinoma. Cancer Cell. 2004;5:215–219. - PubMed
    1. Kim JW, Dang CV. Cancer’s molecular sweet tooth and the Warburg effect. Cancer Res. 2006;66:8927–8930. - PubMed
    1. Brahimi-Horn MC, Chiche J, Pouyssegur J. Hypoxia signalling controls metabolic demand. Curr Opin Cell Biol. 2007;19:223–229. - PubMed

Publication types

MeSH terms

Substances