. 2009 Jul;50(7):1316-29.
doi: 10.1194/jlr.M900024-JLR200. Epub 2009 Mar 12.

ABCA1 plays no role in the centripetal movement of cholesterol from peripheral tissues to the liver and intestine in the mouse

Affiliations

ABCA1 plays no role in the centripetal movement of cholesterol from peripheral tissues to the liver and intestine in the mouse

Chonglun Xie et al. J Lipid Res. 2009 Jul.

Abstract

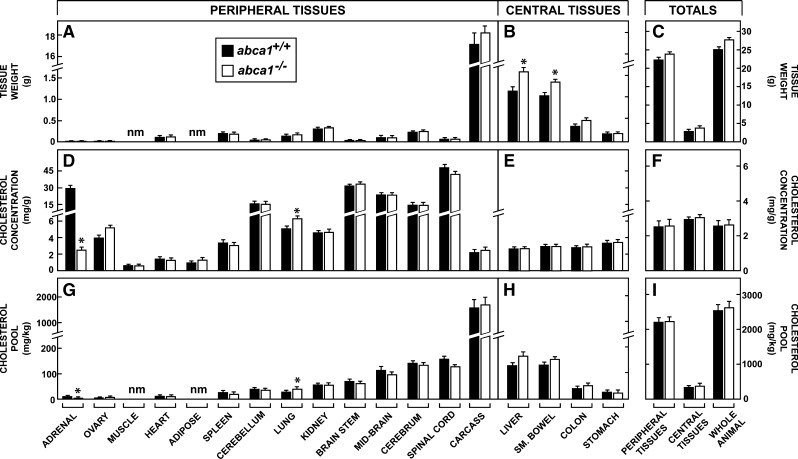
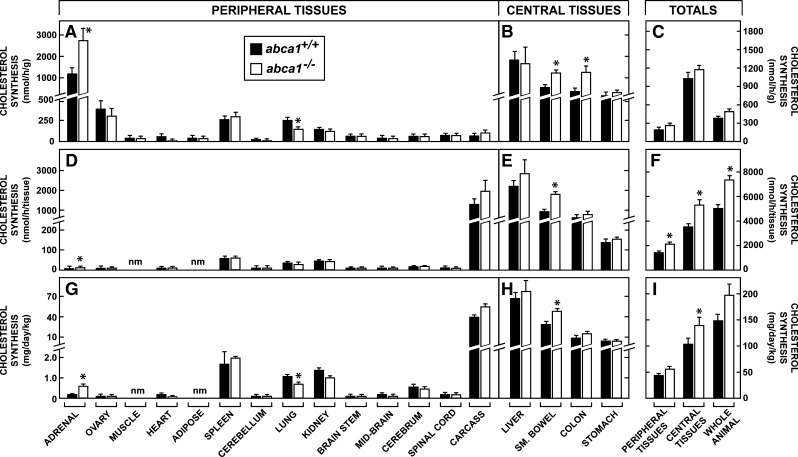
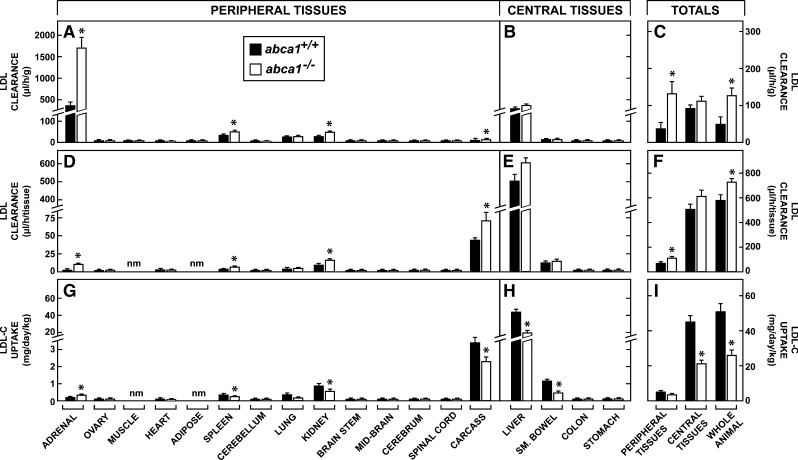
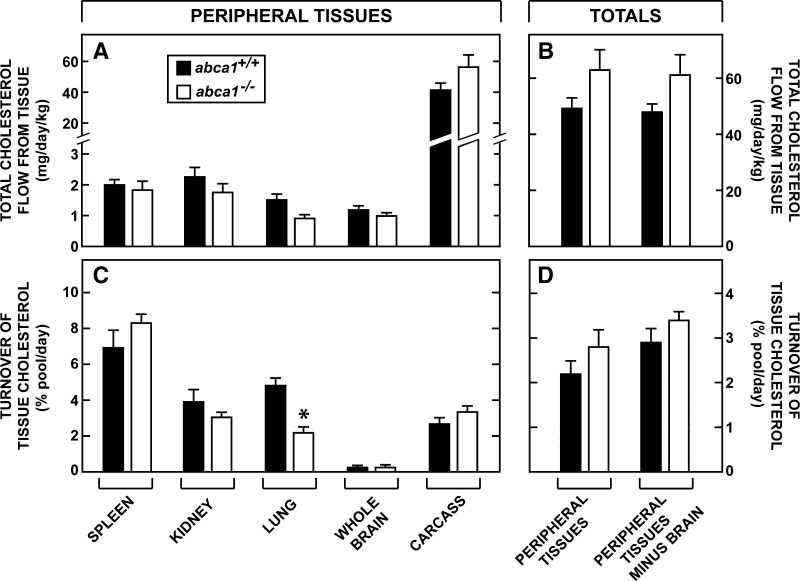
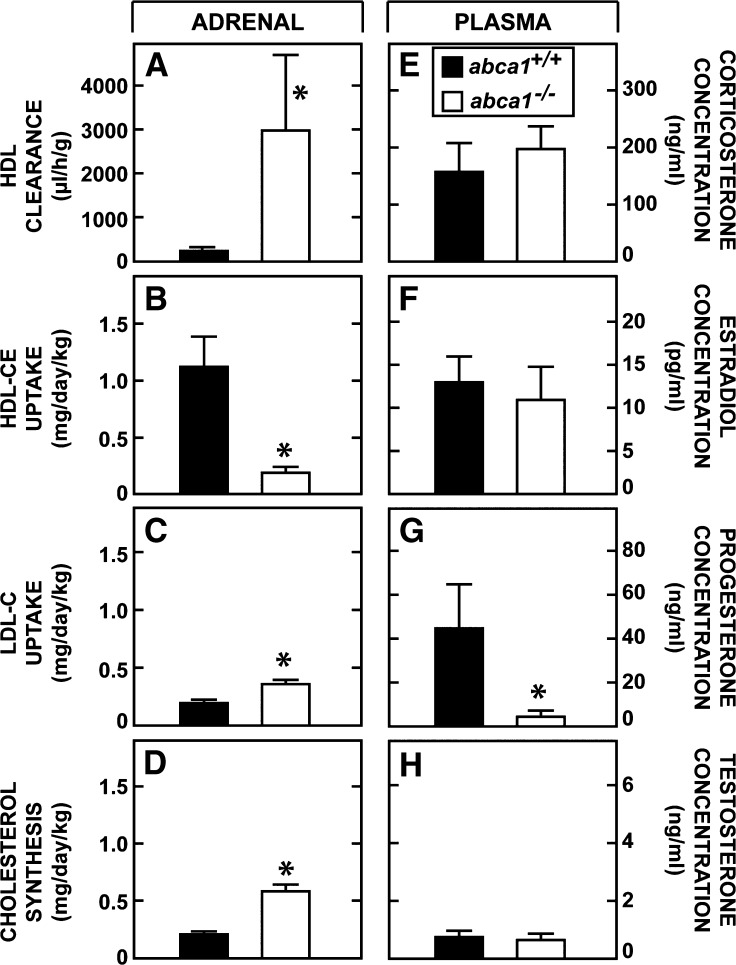
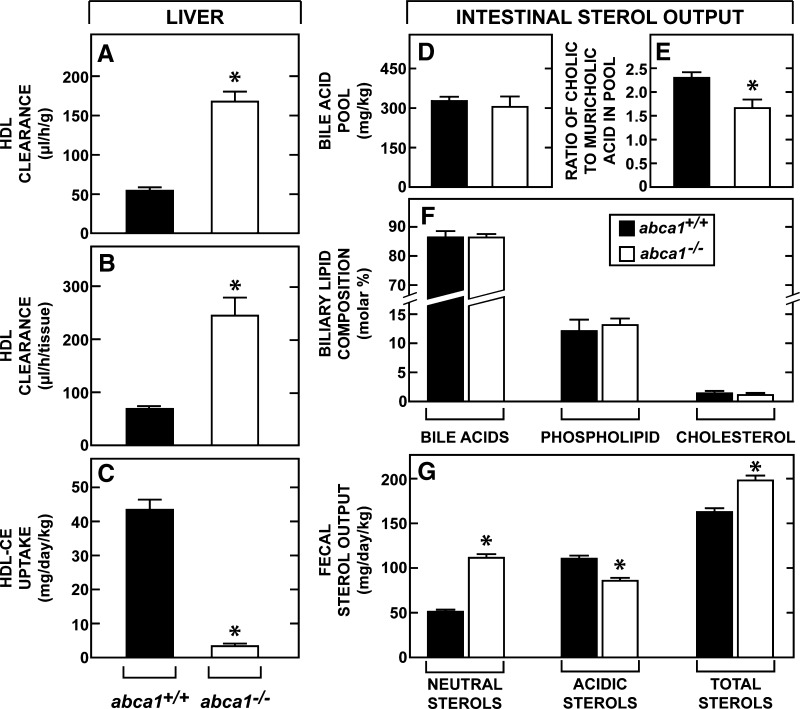
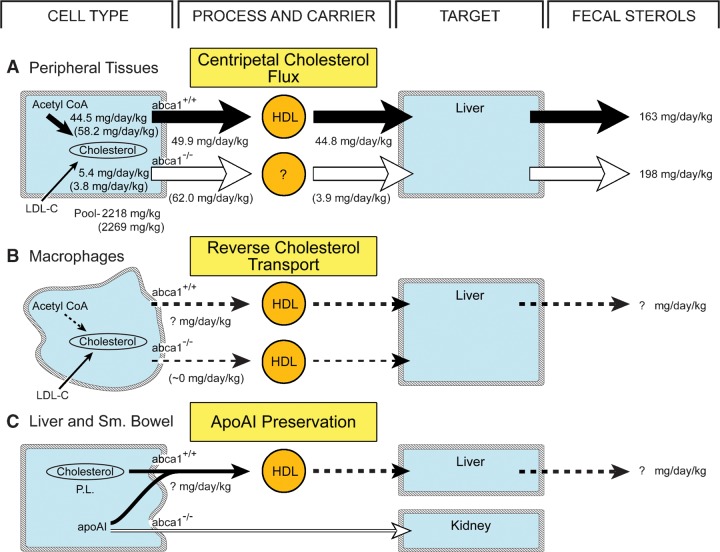
This study uses the mouse to explore the role of ABCA1 in the movement of this cholesterol from the peripheral organs to the endocrine glands for hormone synthesis and liver for excretion. The sterol pool in all peripheral organs was constant and equaled 2,218 and 2,269 mg/kg, respectively, in abca1(+/+) and abca1(-/-) mice. Flux of cholesterol from these tissues equaled the rate of synthesis plus the rate of LDL-cholesterol uptake and was 49.9 mg/day/kg in control animals and 62.0 mg/day/kg in abca1(-/-) mice. In the abca1(+/+) animals, this amount of cholesterol moved from HDL into the liver for excretion. In the abca1(-/-) mice, the cholesterol from the periphery also reached the liver but did not use HDL. Fecal excretion of cholesterol was just as high in abac1(-/-) mice (198 mg/day/kg) as in the abac1(+/+) animals (163 mg/day/kg), although the abac1(-/-) mice excreted relatively more neutral than acidic sterols. This study established that ABCA1 plays essentially no role in the turnover of cholesterol in peripheral organs or in the centripetal movement of this sterol to the endocrine glands, liver, and intestinal tract for excretion.


Figures

Fig. 1.
Fig. 1.
Plasma lipoprotein cholesterol concentrations in 3-month-old female abca1+/+ and abc1−/− mice maintained on a low-cholesterol diet. Plasma was pooled from groups of six to eight mice of each genotype and fractionated by either HPLC (A) or by ultracentrifugation (B–D).
Fig. 2.
Fig. 2.
Organ weights, cholesterol concentrations, and cholesterol pools in 3-month-old female abca1+/+ and abca1−/− mice maintained on a low-cholesterol diet. These organs have been divided into peripheral tissues, which largely must deliver their cholesterol to HDL for transport to the liver for excretion, and central tissues, which can potentially deliver their cholesterol directly into the gastrointestinal tract for excretion. The absolute weight of each tissue is shown (A, B) as well as the total weight of the peripheral and central organs (C). The tissue identified as carcass is what remains when all other organs have been removed and consists largely of muscle, adipose tissue, skin, and bone, including marrow. The concentration of cholesterol in each of these tissues is expressed as milligrams per gram wet weight (D, E), and the average concentrations for all of the peripheral and central tissues and for the whole animal (F) are also illustrated. These concentration values were multiplied by the respective organ weights to obtain the size of the cholesterol pool present in each tissue. These values, in turn, were normalized to a constant body weight of 1 kg so that the size of the cholesterol pool present in each tissue is expressed as milligrams per kilogram of body weight (G, H). These latter values were summed to yield the cholesterol pools present in the peripheral and central tissues and in the whole animal (I). The sizes of the cholesterol pools in muscle and adipose tissue were not measured individually, but these are included in the carcass. The abbreviation “nm” means not measured. The asterisk identifies those values that are significantly different (P < 0.05) from the corresponding values in the abca1+/+ mice. Each column represents the mean ± 1 SEM of data from six to seven animals.
Fig. 3.
Fig. 3.
Rates of cholesterol synthesis in 3-month-old female abca1+/+ and abca1−/− mice maintained on a low-cholesterol diet. Rates of synthesis were measured in vivo and expressed as the nmol of [3H]water incorporated into sterols per hour per gram of tissue (A, B). These data were averaged to yield the mean rates of synthesis in the peripheral and central tissues and in the whole animal (C). These values were multiplied by the appropriate organ weights in each animal to give the rates of synthesis in each whole tissue (D, E), and these were summed to give total rates of synthesis in the peripheral and central organs and in the whole animal (F). These rates were then extended to 24 h, adjusted to a constant body weight of 1 kg, and converted to milligrams of cholesterol synthesized per day per kilogram (G, H). The values in the individual tissues were summed to give absolute rates of cholesterol synthesis in the peripheral and central compartments and in the whole animal (I). The abbreviation “nm” means not measured. The asterisk identifies those values that are significantly different (P < 0.05) from the corresponding values in the abca1+/+ mice. Each column represents the mean ± 1 SEM of data from six to seven animals.
Fig. 4.
Fig. 4.
Rates of LDL clearance and LDL-C uptake in 3-month-old female abca1+/+ and abca1−/− mice maintained on a low-cholesterol diet. Rates of LDL clearance were measured as the microliter of plasma cleared of LDL per hour per gram (A, B), and these values were averaged to give the mean rates of clearance in the peripheral and central tissues (C). These values were then multiplied by the appropriate organ weights in each animal to give the rates of clearance in each whole tissue (D, E), and these were summed to give total rates of clearance in the peripheral and central tissues (F). Using the total cholesterol concentration in the LDL fraction in the plasma of these two genotypes, these rates were extended to 24 h and adjusted to a constant body weight of 1 kg to yield the milligrams of LDL-C taken up into these tissues each day per kilogram (G, H). These values were summed to give the absolute rates of LDL-C uptake into the peripheral and central tissues and by the whole animal (I). The abbreviation “nm” means not measured. The asterisk identifies those values that are significantly different (P < 0.05) from the corresponding values in the abca1+/+ mice. Each column represents the mean ± 1 SEM of data from 6 to 10 animals.
Fig. 5.
Fig. 5.
Total flow of cholesterol from the peripheral tissues. The rates of total sterol acquisition from synthesis (Fig. 3G) and LDL-C uptake (Fig. 4G) were summed to obtain the amount of cholesterol that must leave the major peripheral organs each day (A). The total flow of cholesterol from all peripheral organs, as well as the flow from the peripheral tissues minus the brain, were also calculated (B). Each value was divided by the size of the respective cholesterol pool in that tissue to yield the daily turnover rate (C). Similarly, the mean turnover of cholesterol in all of the tissues of the periphery and in the organs of the periphery excluding the brain, was also calculated (D). The asterisk identifies those values that are significantly different (P < 0.05) from the corresponding values in the abca1+/+ mice. Each column represents the mean ± 1 SEM.
Fig. 6.
Fig. 6.
Rates of cholesterol utilization by the adrenal and plasma steroid hormone levels. Rates of HDL clearance were measured in the adrenal (A), and using the concentration of cholesteryl esters in the HDL fraction of these two genotypes, these values were used to calculate the rate of HDL-CE uptake by this gland (B). For comparison, the rates of LDL-C uptake (from Fig. 4G) and cholesterol synthesis (from Fig. 3G) are shown in C and D, respectively. The plasma concentration of four different steroid hormones is also shown (E–H). The asterisk identifies those values that are significantly different (P < 0.05) from the corresponding values in the abca1+/+ mice. Each column represents the mean ± 1 SEM of data from 6 to 10 animals in the first set of data (A–D) and from 8 to 15 mice in the second group (E–H).
Fig. 7.
Fig. 7.
Rates of HDL-CE clearance and uptake by the liver, bile acid pool size and composition, and rates of fecal sterol excretion. Rates of hepatic HDL clearance were measured (A, B) and, along with the concentration of cholesteryl esters in the HDL fraction of these two genotypes, were used to calculate the rates of HDL-CE uptake by the liver (C). The amount of bile acid present in the liver, biliary tract, and entire small bowel combined was measured and is presented as the bile acid pool size (D). The ratio of cholic acid to muricholic acid in this pool was also determined (E). The molar ratios of bile acid, phospholipid, and cholesterol in bile obtained from the gallbladder was quantitated (F). In a separate group of animals, feces were collected for determination of the daily output of both neutral and acidic sterols (G). The asterisk identifies those values that are significantly different (P < 0.05) from the corresponding values in the abca1+/+ mice. Each column represents the mean ± 1 SEM of data in 6 to 10 animals in each group in the first set of data (A–C), five animals in the second set (D, E), four animals in the third (F), and 10 animals in the last set (G).
Fig. 8.
Fig. 8.
Three major pathways in which ABCA1 and HDL might be involved. The first (A) represents the centripetal movement of cholesterol out of the parenchymal cells of the peripheral organs during plasma membrane sterol turnover. The contribution of synthesis and LDL-C uptake to this normal turnover is shown for both the abca1+/+ (numbers without parentheses) and abca1−/− (numbers in parentheses) animals. Also shown are the rates of cholesteryl ester movement from HDL to the liver and the rates of total sterol excretion in the feces. The second pathway (B) represents reverse cholesterol transport from primarily macrophages in the periphery. These flux rates are very small and essentially unmeasurable. Finally, the third pathway (C) illustrates the role of ABCA1 in transferring cholesterol and phospholipids from cells of the liver and small bowel to newly synthesized apoAI in order to prevent its rapid degradation and excretion by the kidneys. Again, this flux is presumably very small.

References

    1. Simons K., and E. Ikonen. 2000. How cells handle cholesterol. Science. 290 1721–1726. - PubMed
    1. Alberts, B., D. Bray, J. Lewis, M. Raff, K. Roberts, and J. D. Watson. 1989. The plasma membrane. In Molecular Biology of the Cell. M. Robertson, editor. Garland Publishing, New York. 275–340.
    1. Dietschy J. M., T. Kita, K. E. Suckling, J. L. Goldstein, and M. S. Brown. 1983. Cholesterol synthesis in vivo and in vitro in the WHHL rabbit, an animal with defective low density lipoprotein receptors. J. Lipid Res. 24 469–480. - PubMed
    1. Belknap W. M., and J. M. Dietschy. 1988. Sterol synthesis and low density lipoprotein clearance in vivo in the pregnant rat, placenta, and fetus. J. Clin. Invest. 82 2077–2085. - PMC - PubMed
    1. Quan G., C. Xie, J. M. Dietschy, and S. D. Turley. 2003. Ontogenesis and regulation of cholesterol metabolism in the central nervous system of the mouse. Brain Res. Dev. Brain Res. 146 87–98. - PubMed

Publication types

MeSH terms