. 2009 Apr 16;28(15):1812-20.
doi: 10.1038/onc.2009.13. Epub 2009 Mar 16.

Cyclin D1b protein expression in breast cancer is independent of cyclin D1a and associated with poor disease outcome

Affiliations

Cyclin D1b protein expression in breast cancer is independent of cyclin D1a and associated with poor disease outcome

E K A Millar et al. Oncogene. .

Abstract

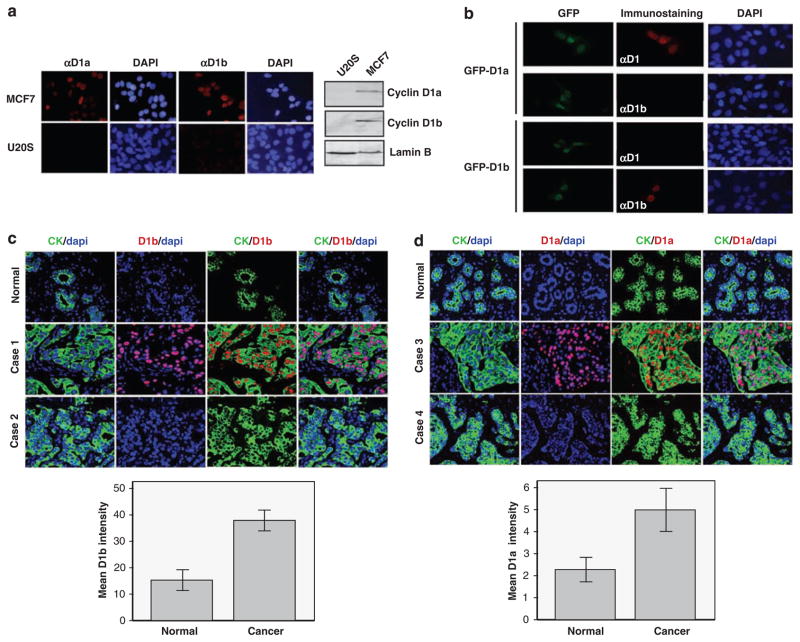
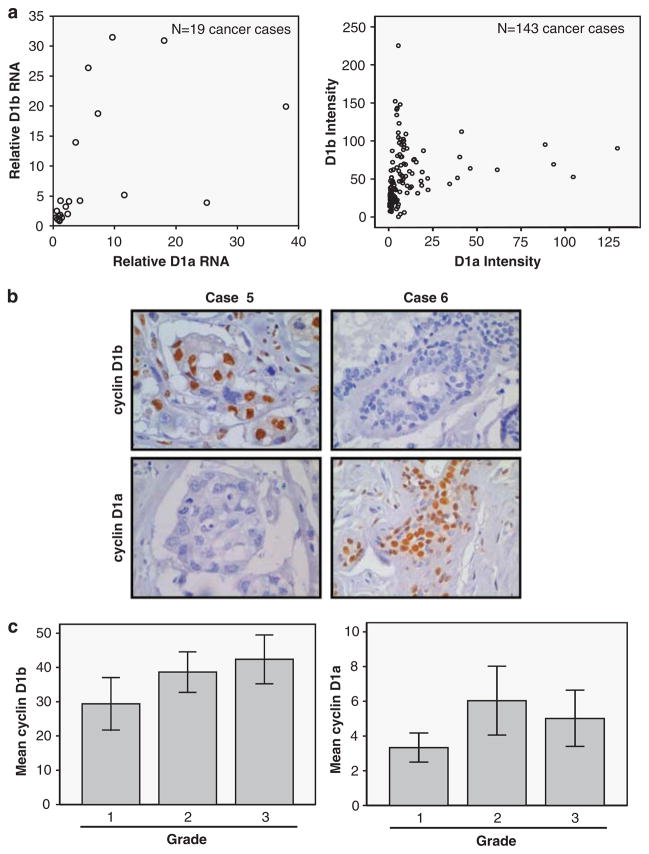
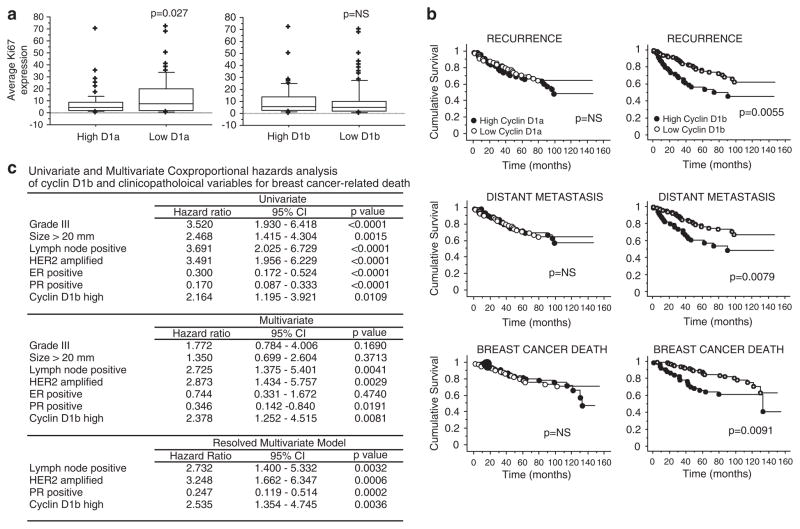
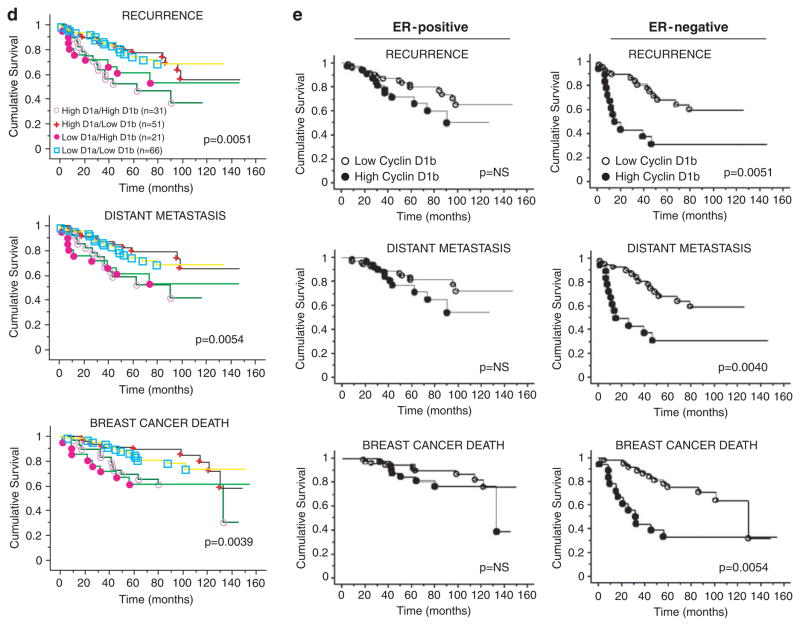
Aberrant expression of cyclin D1 protein is a common feature of breast cancer. However, the CCND1 gene encodes two gene products, cyclin D1a and cyclin D1b, which have discrete mechanisms of regulation and impact on cell behavior. A polymorphism at nucleotide 870 in the CCND1 gene, rs603965, influences the relative production of the encoded proteins and can impart increased risk for tumor development. Here, the impact of both the G/A870 polymorphism and cyclin D1b protein production on breast cancer risk, disease phenotype and patient outcome was analysed. In a large multiethnic case-control study, the G/A870 polymorphism conferred no significant risk for breast cancer overall or by stage or estrogen receptor (ER) status. However, the cyclin D1b protein was found to be upregulated in breast cancer, independent of cyclin D1a levels, and exhibited heterogeneous levels in breast cancer specimens. High cyclin D1a expression inversely correlated with the Ki67 proliferation marker and was not associated with clinical outcome. In contrast, elevated cyclin D1b expression was independently associated with adverse outcomes, including recurrence, distant metastasis and decreased survival. Interestingly, cyclin D1b was particularly associated with poor outcome in the context of ER-negative breast cancer. Thus, specific cyclin D1 isoforms are associated with discrete forms of breast cancer and high cyclin D1b protein levels hold prognostic potential.


Figures

Figure 1
Figure 1
Cyclin D1a and cyclin D1b expression is elevated in breast cancer. (a) U2OS and MCF-7 cells were stained with cyclin D1a or cyclin D1b antibodies as indicated (left panel). Representative images taken at equal exposures for cyclin D1/cyclin D1b are shown. U2OS and MCF-7 cell lysates were subjected to immunoblotting with the indicated antibodies (right panel). (b) U2OS cells were transfected with the GFP-cyclin D1a or GFP-cyclin D1b expression plasmids as indicated. These cell populations were then stained with cyclin D1a or cyclin D1b antibodies. Representative images taken at equal exposure are shown. (c) Slides were co-stained for cyclin D1b and cytokeratin (CK) to detect epithelial cells. DAPI staining was used to detect all nuclei in the section. Representative images of specific breast cancer cases and normal controls are shown (top panel). Quantitation of the D1b signal in the CK-positive compartment was carried out and data were obtained from 39 normal specimens and 150 invasive ductal carcinomas (bottom panel; error bars indicate 95% CI, P<0.001). Student’s t-test was carried out. (d) Slides were co-stained for cyclin D1a and cytokeratin (CK) to detect epithelial cells. DAPI staining was utilized to detect all nuclei in the section. Representative images of specific breast cancer cases and normal controls are shown (top panel). Quantitation of the D1a signal in the CK-positive compartment was carried out from 44 normal specimens and 148 invasive ductal carcinomas (bottom panel; error bars indicate 95% CI, P<0.001). Student’s t-test was carried out.
Figure 2
Figure 2
Cyclin D1b defines a population of breast cancer distinct from cyclin D1a. (a) Quantitative reverse transcription PCR was performed to determine the relative levels of cyclin D1a- and cyclin D1b-specific RNA, wherein signal from non-neoplastic was set to ‘1’ (left panel). The absolute intensity of cyclin D1b vs cyclin D1a in a total of 143 breast cancer specimens is shown (right panel). (b) Specific cases show preferentially the expressions of cyclin D1b (case 5) and cyclin D1a (case 6). (c) Cyclin D1b or cyclin D1a intensity was determined as a function of tumor grade (error bars indicate 95% CI). Cyclin D1b levels are associated with increased tumor grade (P=0.014) and cyclin D1a levels are not associated with increased tumor grade (P>0.5). ANOVA statistical test was carried out.
Figure 3
Figure 3
Cyclin D1b is associated with poor outcome in breast cancer. (a) Relationship between cyclin D1a and cyclin D1b levels and the proliferation marker Ki67 were monitored. Box plots depict data for cyclin D1a low (n=73), cyclin D1a high (n=74), dichotomized on the median H-score, and cyclin D1b low (n=98) and cyclin D1b high (n=50) dichotomized at an intensity >2+, as related to the percentage of Ki67-positive cells. A significant inverse correlation between cyclin D1a levels and Ki67 was detected (P=0.0256) using the Mann–Whitney non-parametric test. (b) The Kaplan–Meier analysis for cyclin D1a and cyclin D1b expression was carried out in the entire cohort. Graphs represent analyses carried out for recurrence, distant metastasis and breast cancer-related death. Left panel: high cyclin D1a expressors (n=82) are represented by ● and low cyclin D1a expressors (n=87) are represented by ○;. Right panel: high cyclin D1b expressors (n=52) are represented by ● and low cyclin D1b expressors (n=123) are represented by ○. Statistical analyses were carried out using the log-rank test. (c) Summary of statistical analyses of cyclin D1b by univariate and multivariate analyses. Details of the analyses are provided in the Supplementary Materials and methods. (d) The Kaplan–Meier analysis was carried out for distinct cyclin D1a/D1b-isoform subsets in the entire cohort. High cyclin D1a/high cyclin D1b expressors (n=31) are represented by ○, high cyclin D1a/low cyclin D1b expressors (n=51) are represented by +, low cyclin D1a/high cyclin D1b expressors (n=21) by ●, and low cyclin D1a/low cyclin D1b expressors (n=66) are represented by □. Statistical analyses were carried out using the log-rank test. (e) Kaplan–Meier graphs for cyclin D1b expression stratified by ER status. Graphs represent analyses carried out for recurrence, distant metastasis and breast cancer-related death among ER-positive or ER-negative cases. High cyclin D1b expressors are represented by ● and low cyclin D1b expressors by ○. Statistical analyses were carried out using the log-rank test.
Figure 3
Figure 3
Cyclin D1b is associated with poor outcome in breast cancer. (a) Relationship between cyclin D1a and cyclin D1b levels and the proliferation marker Ki67 were monitored. Box plots depict data for cyclin D1a low (n=73), cyclin D1a high (n=74), dichotomized on the median H-score, and cyclin D1b low (n=98) and cyclin D1b high (n=50) dichotomized at an intensity >2+, as related to the percentage of Ki67-positive cells. A significant inverse correlation between cyclin D1a levels and Ki67 was detected (P=0.0256) using the Mann–Whitney non-parametric test. (b) The Kaplan–Meier analysis for cyclin D1a and cyclin D1b expression was carried out in the entire cohort. Graphs represent analyses carried out for recurrence, distant metastasis and breast cancer-related death. Left panel: high cyclin D1a expressors (n=82) are represented by ● and low cyclin D1a expressors (n=87) are represented by ○;. Right panel: high cyclin D1b expressors (n=52) are represented by ● and low cyclin D1b expressors (n=123) are represented by ○. Statistical analyses were carried out using the log-rank test. (c) Summary of statistical analyses of cyclin D1b by univariate and multivariate analyses. Details of the analyses are provided in the Supplementary Materials and methods. (d) The Kaplan–Meier analysis was carried out for distinct cyclin D1a/D1b-isoform subsets in the entire cohort. High cyclin D1a/high cyclin D1b expressors (n=31) are represented by ○, high cyclin D1a/low cyclin D1b expressors (n=51) are represented by +, low cyclin D1a/high cyclin D1b expressors (n=21) by ●, and low cyclin D1a/low cyclin D1b expressors (n=66) are represented by □. Statistical analyses were carried out using the log-rank test. (e) Kaplan–Meier graphs for cyclin D1b expression stratified by ER status. Graphs represent analyses carried out for recurrence, distant metastasis and breast cancer-related death among ER-positive or ER-negative cases. High cyclin D1b expressors are represented by ● and low cyclin D1b expressors by ○. Statistical analyses were carried out using the log-rank test.

References

    1. Arnold A, Papanikolaou A. Cyclin D1 in breast cancer pathogenesis. J Clin Oncol. 2005;23:4215–4224. - PubMed
    1. Bala S, Peltomaki P. Cyclin D1 as a genetic modifier in hereditary nonpolyposis colorectal cancer. Cancer Res. 2001;61:6042–6045. - PubMed
    1. Barnes DM, Gillett CE. Cyclin D1 in breast cancer. Breast Cancer Res Treat. 1998;52:1–15. - PubMed
    1. Batsche E, Yaniv M, Muchardt C. The human SWI/SNF subunit Brm is a regulator of alternative splicing. Nat Struct Mol Biol. 2006;13:22–29. - PubMed
    1. Betticher DC, Thatcher N, Altermatt HJ, Hoban P, Ryder WD, Heighway J. Alternate splicing produces a novel cyclin D1 transcript. Oncogene. 1995;11:1005–1011. - PubMed

Publication types