

Flow cytometry analysis of neural differentiation markers expression in human glioblastomas may predict their response to chemotherapy
- PMID: 19288188
- PMCID: PMC11505807
- DOI: 10.1007/s10571-009-9366-6
Flow cytometry analysis of neural differentiation markers expression in human glioblastomas may predict their response to chemotherapy
Abstract
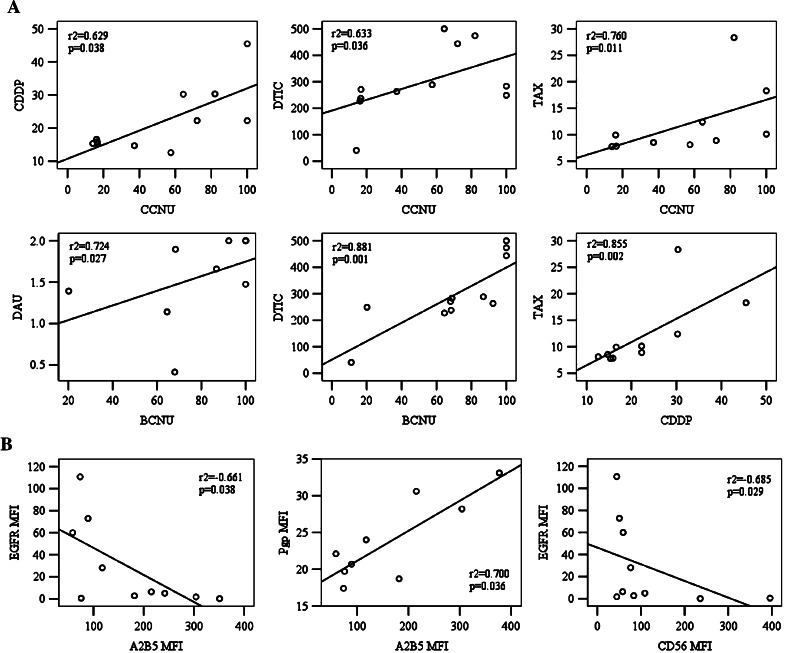
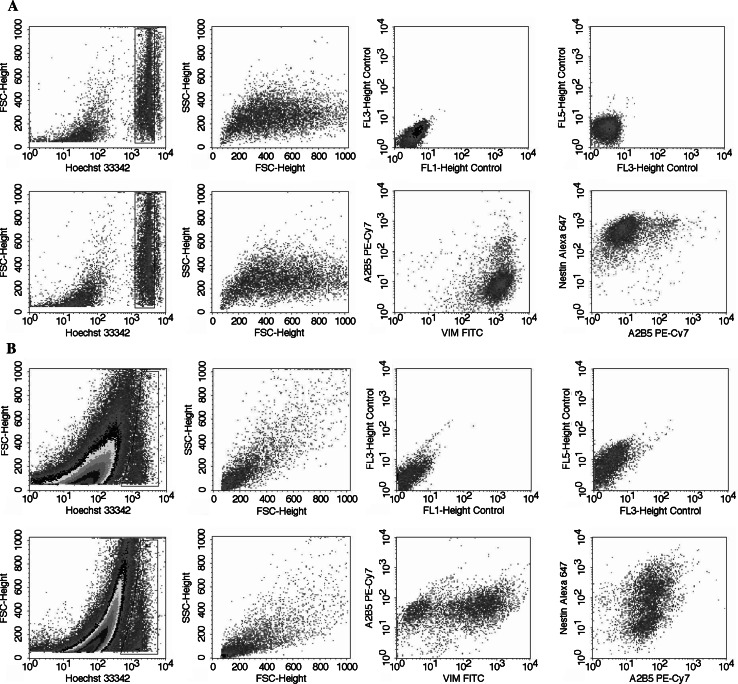
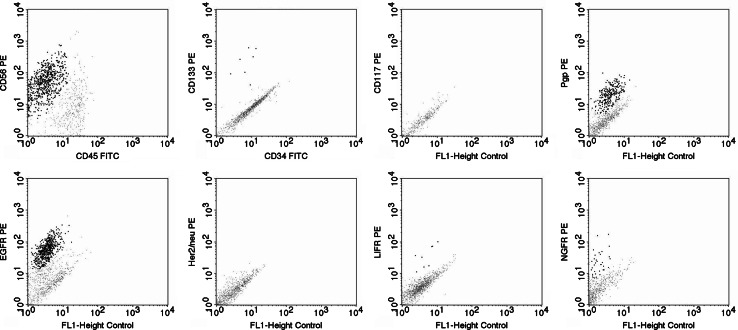
Glioblastoma multiforme (GBM) represents an extremely chemoresistant tumour type. Here, authors analysed the immunophenotype of GBM tumours by flow cytometry and correlated the immunophenotypic characteristics with sensitivity to chemotherapy. The expression of selected neural and non-neural differentiation markers including A2B5, CD34, CD45, CD56, CD117, CD133, EGFR, GFAP, Her-2/neu, LIFR, nestin, NGFR, Pgp and vimentin was analysed by flow cytometry in eleven GBM (WHO gr.IV) patients. The sensitivity of tumour cells to a panel of chemotherapeutic agents was tested by the MTT assay. All tumours were positive for A2B5, CD56, nestin and vimentin. CD133, EGFR, LIFR, NGFR and Pgp were expressed only by minor tumour cell subpopulations. CD34, CD45, CD117, GFAP and Her-2/neu were constantly negative. Direct correlations were found between the immunophenotypic markers and chemosensitivity: A2B5 vs lomustine (r(2) = 0.642, P = 0.033), CD56 vs cisplatin (r(2) = 0.745, P = 0.013), %Pgp(+) vs vincristine (r(2) = 0.846, P = 0.008), and %NGFR(+) vs daunorubicine (r(2) = 0.672, P = 0.047) and topotecan (r(2) = 0.792, P = 0.011). In contrast, inverse correlations were observed between: EGFR vs paclitaxel (r(2) = -0.676, P = 0.046), CD133 vs dacarbazine (r(2) = -0.636, P = 0.048) and LIFR vs daunorubicine (r(2) = -0.878, P = 0.004). Finally, significant associations were also found among sensitivities to different chemotherapeutic agents and among different immunophenotypic markers. In conclusion, histopathologically identical GBM tumours displayed a marked immunophenotypic heterogeneity. The expression of A2B5, CD56, NGFR and Pgp appeared to be associated with chemoresistance whereas CD133, EGFR and LIFR expression was characteristic of chemosensitive tumours. We suggest that flow cytometric imunophenotypic analysis of GBM may predict chemoresponsiveness and help to identify patients who could potentially benefit from chemotherapy.
Figures
Similar articles
-
Molecular analysis of ex-vivo CD133+ GBM cells revealed a common invasive and angiogenic profile but different proliferative signatures among high grade gliomas.BMC Cancer. 2010 Aug 24;10:454. doi: 10.1186/1471-2407-10-454. BMC Cancer. 2010. PMID: 20735813 Free PMC article.
-
CD133/CD15 defines distinct cell subpopulations with differential in vitro clonogenic activity and stem cell-related gene expression profile in in vitro propagated glioblastoma multiforme-derived cell line with a PNET-like component.Folia Neuropathol. 2012;50(4):357-68. doi: 10.5114/fn.2012.32365. Folia Neuropathol. 2012. PMID: 23319191
-
A2B5 cells from human glioblastoma have cancer stem cell properties.Brain Pathol. 2010 Jan;20(1):211-21. doi: 10.1111/j.1750-3639.2009.00269.x. Epub 2009 Feb 20. Brain Pathol. 2010. PMID: 19243384 Free PMC article.
-
Expression of molecular markers and synergistic anticancer effects of chemotherapy with antimicrobial peptides on glioblastoma cells.Cancer Chemother Pharmacol. 2024 May;93(5):455-469. doi: 10.1007/s00280-023-04622-8. Epub 2024 Jan 27. Cancer Chemother Pharmacol. 2024. PMID: 38280033
-
Chemoresistance in high-grade gliomas: relevance of adenosine signalling in stem-like cells of glioblastoma multiforme.Curr Drug Targets. 2014;15(10):931-42. Curr Drug Targets. 2014. PMID: 25174341 Review.
Cited by
-
Glioblastoma with PNET-like components has a higher frequency of isocitrate dehydrogenase 1 (IDH1) mutation and likely a better prognosis than primary glioblastoma.Int J Clin Exp Pathol. 2011;4(7):651-60. Epub 2011 Sep 17. Int J Clin Exp Pathol. 2011. PMID: 22076165 Free PMC article.
-
Cerebrospinal fluid cytokine levels are associated with macrophage infiltration into tumor tissues of glioma patients.BMC Cancer. 2021 Oct 15;21(1):1108. doi: 10.1186/s12885-021-08825-1. BMC Cancer. 2021. PMID: 34654395 Free PMC article.
-
Bone Marrow Stromal Antigen 2 Is a Novel Plasma Biomarker and Prognosticator for Colorectal Carcinoma: A Secretome-Based Verification Study.Dis Markers. 2015;2015:874054. doi: 10.1155/2015/874054. Epub 2015 Oct 1. Dis Markers. 2015. PMID: 26494939 Free PMC article.
-
Molecular alterations in glioblastoma: potential targets for immunotherapy.Prog Mol Biol Transl Sci. 2011;98:187-234. doi: 10.1016/B978-0-12-385506-0.00005-3. Prog Mol Biol Transl Sci. 2011. PMID: 21199773 Free PMC article. Review.
-
Targeted sequencing reveals genetic variants associated with sensitivity of 79 human cancer xenografts to anticancer drugs.Exp Ther Med. 2018 Feb;15(2):1339-1359. doi: 10.3892/etm.2017.5533. Epub 2017 Nov 21. Exp Ther Med. 2018. PMID: 29434720 Free PMC article.
References
-
- Almqvist PM, Mah R, Lendahl U, Jacobsson B, Hendson G (2002) Immunohistochemical detection of nestin in pediatric brain tumors. J Histochem Cytochem 50:147–158 - PubMed
-
- Amano T, Yamakuni T, Okabe N, Kuwahara R, Ozawa F, Hishinuma F (1992) Regulation of nerve growth factor and nerve growth factor receptor production by NMDA in C6 glioma cells. Brain Res Mol Brain Res 14:35–42. doi:10.1016/0169-328X(92)90007-X - PubMed
-
- Andersson U, Malmer B, Bergenheim AT, Brannstrom T, Henriksson R (2004) Heterogeneity in the expression of markers for drug resistance in brain tumors. Clin Neuropathol 23:21–27 - PubMed
-
- Armstrong L, Stojkovic M, Dimmick I, Ahmad S, Stojkovic P, Hole N, Lako M (2004) Phenotypic characterization of murine primitive hematopoietic progenitor cells isolated on basis of aldehyde dehydrogenase activity. Stem Cells 22:1142–1151. doi:10.1634/stemcells.2004-0170 - PubMed
Publication types
MeSH terms
Substances
LinkOut - more resources
Full Text Sources
Medical
Research Materials
Miscellaneous
