Functional and effective connectivity of visuomotor control systems demonstrated using generalized partial least squares and structural equation modeling
- PMID: 19288462
- PMCID: PMC2831874
- DOI: 10.1002/hbm.20664
Functional and effective connectivity of visuomotor control systems demonstrated using generalized partial least squares and structural equation modeling
Abstract
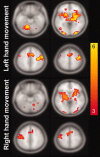
Tasks employing parametric variation in movement rate are associated with predictable modulations in neural activity and provide a convenient context for developing new techniques for system identification. Using a multistage approach, we explored the functional and effective connectivity of a visuomotor control system by combining generalized partial least squares (gPLS) with subsequent structural equation modeling (SEM) to reveal the relationships between neural activity and finger movement rate in an experiment involving visually paced left or right thumb flexion. The gPLS in the first analysis stage automatically identified spatially distributed sets of BOLD-contrast signal changes using linear combinations of sigmoidal basis functions parameterized by kinematic variables. The gPLS provided superior sensitivity in detecting task-related functional activity patterns via a step-wise comparison with both classical linear modeling and behavior correlation analysis. These activity patterns were used in the second analysis stage, which employed SEM to characterize the areal regional interactions. The hybrid gPLS/SEM procedure allowed modeling of complex regional interactions in a network including primary motor cortex, premotor areas, cerebellum, thalamus, and basal ganglia, with differential activity modulations with respect to rate observed in the corticocerebellar and corticostriate subsystems. This effective connectivity analysis of visuomotor control circuits showed that both the left and right corticocerebellar and corticostriate circuits exhibited movement rate-related modulation. The identification of the functional connectivity among regions participating particular classes of behavior using gPLS, followed by the estimation of the effective connectivity using SEM is an efficient means to characterize the neural interactions underlying variations in sensorimotor behavior.
Copyright 2009 Wiley-Liss, Incv
Figures


Similar articles
-
Characterization of Cortical Networks and Corticocortical Functional Connectivity Mediating Arbitrary Visuomotor Mapping.J Neurosci. 2015 Sep 16;35(37):12643-58. doi: 10.1523/JNEUROSCI.4892-14.2015. J Neurosci. 2015. PMID: 26377456 Free PMC article.
-
Multivariate analysis of neuronal interactions in the generalized partial least squares framework: simulations and empirical studies.Neuroimage. 2003 Oct;20(2):625-42. doi: 10.1016/S1053-8119(03)00333-1. Neuroimage. 2003. PMID: 14568440
-
A functional MRI study of motor dysfunction in Friedreich's ataxia.Brain Res. 2012 Aug 30;1471:138-54. doi: 10.1016/j.brainres.2012.06.035. Epub 2012 Jul 3. Brain Res. 2012. PMID: 22771856
-
Principle of structural equation modeling for exploring functional interactivity within a putative network of interconnected brain areas.Magn Reson Imaging. 2009 Jan;27(1):1-12. doi: 10.1016/j.mri.2008.05.003. Epub 2008 Jun 26. Magn Reson Imaging. 2009. PMID: 18584986 Review.
-
Re-evaluating Circuit Mechanisms Underlying Pattern Separation.Neuron. 2019 Feb 20;101(4):584-602. doi: 10.1016/j.neuron.2019.01.044. Neuron. 2019. PMID: 30790539 Free PMC article. Review.
Cited by
-
Ultrafast inverse imaging techniques for fMRI.Neuroimage. 2012 Aug 15;62(2):699-705. doi: 10.1016/j.neuroimage.2012.01.072. Epub 2012 Jan 21. Neuroimage. 2012. PMID: 22285221 Free PMC article. Review.
-
Performance control during longitudinal activation fMRI studies.Front Hum Neurosci. 2024 Oct 15;18:1459140. doi: 10.3389/fnhum.2024.1459140. eCollection 2024. Front Hum Neurosci. 2024. PMID: 39474131 Free PMC article. Review.
-
A cerebellar thalamic cortical circuit for error-related cognitive control.Neuroimage. 2011 Jan 1;54(1):455-64. doi: 10.1016/j.neuroimage.2010.07.042. Epub 2010 Jul 23. Neuroimage. 2011. PMID: 20656038 Free PMC article.
-
Activations in gray and white matter are modulated by uni-manual responses during within and inter-hemispheric transfer: effects of response hand and right-handedness.Brain Imaging Behav. 2018 Aug;12(4):942-961. doi: 10.1007/s11682-017-9750-7. Brain Imaging Behav. 2018. PMID: 28808866 Free PMC article.
-
Parietal operculum and motor cortex activities predict motor recovery in moderate to severe stroke.Neuroimage Clin. 2017 Jan 26;14:518-529. doi: 10.1016/j.nicl.2017.01.023. eCollection 2017. Neuroimage Clin. 2017. PMID: 28317947 Free PMC article.
References
-
- Agnew JA,Zeffiro TA,Eden GF ( 2004): Left hemisphere specialization for the control of voluntary movement rate. Neuroimage 22: 289–303. - PubMed
-
- Allison JD,Meador KJ,Loring DW,Figueroa RE,Wright JC ( 2000): Functional MRI cerebral activation and deactivation during finger movement. Neurology 54: 135–142. - PubMed
-
- Amunts K,Schlaug G,Schleicher A,Steinmetz H,Dabringhaus A,Roland PE,Zilles K ( 1996): Asymmetry in the human motor cortex and handedness. Neuroimage 4: 216–222. - PubMed
-
- Bell AJ,Sejnowski TJ ( 1995): An information‐maximization approach to blind separation and blind deconvolution. Neural Comput 7: 1129–1159. - PubMed
-
- Blinkenberg M,Bonde C,Holm S,Svarer C,Andersen J,Paulson OB,Law I ( 1996): Rate dependence of regional cerebral activation during performance of a repetitive motor task: A PET study. J Cereb Blood Flow Metab 16: 794–803. - PubMed
Publication types
MeSH terms
Grants and funding
LinkOut - more resources
Full Text Sources

