. 2009 Mar 18;96(6):2505-31.
doi: 10.1016/j.bpj.2008.12.3891.

Fluctuation analysis of tetanic rundown (short-term depression) at a corticothalamic synapse

Affiliations

Fluctuation analysis of tetanic rundown (short-term depression) at a corticothalamic synapse

Israeli Ran et al. Biophys J. .

Abstract

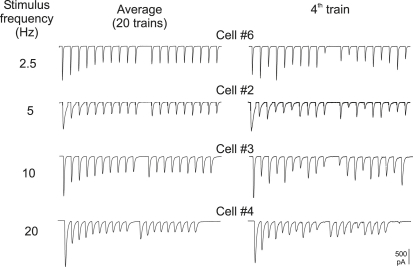
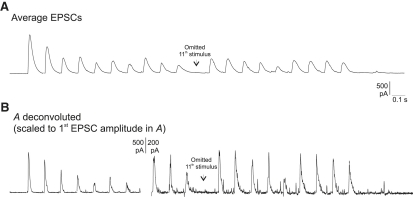
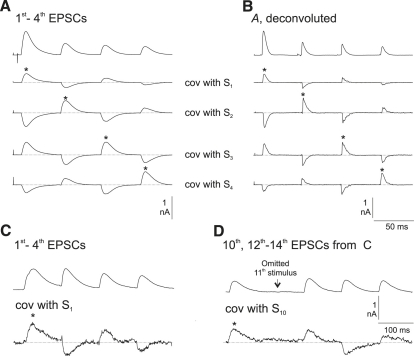
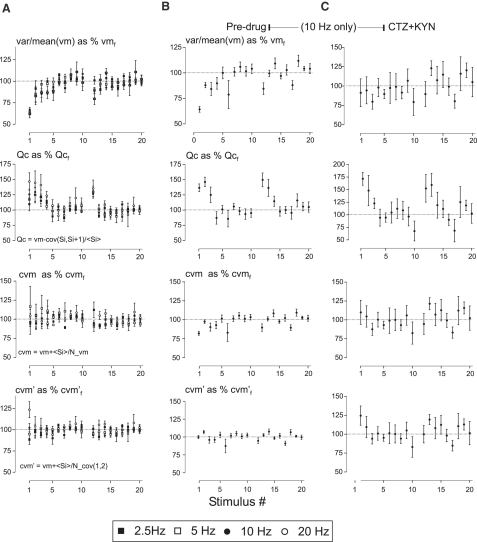
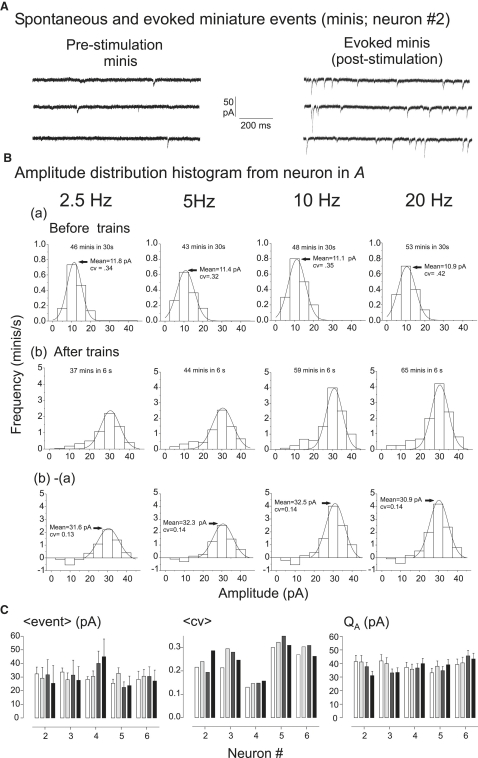
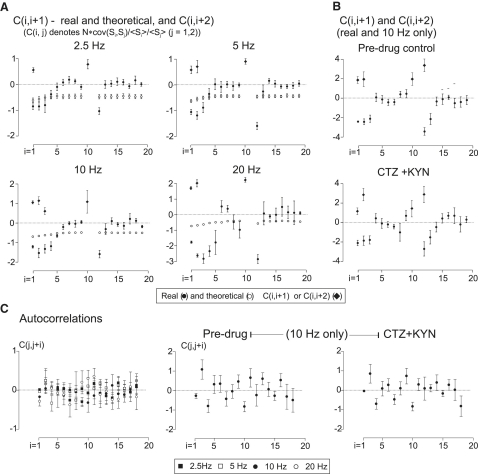
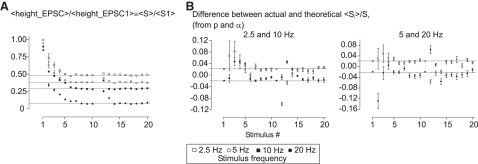
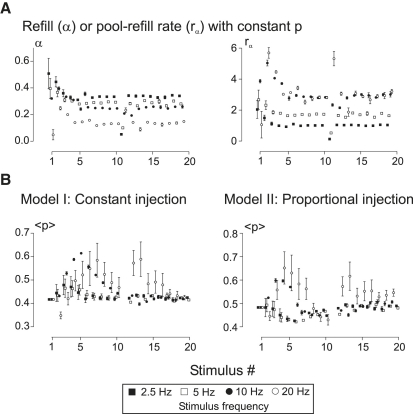
Hypothetical scenarios for "tetanic rundown" ("short-term depression") of synaptic signals evoked by stimulus trains differ in evolution of quantal amplitude (Q) and covariances between signals. With corticothalamic excitatory postsynaptic currents (EPSCs) evoked by 2.5- to 20-Hz trains, we found Q (estimated using various corrections of variance/mean ratios) to be unchanged during rundown and close to the size of stimulus-evoked "miniatures". Except for covariances, results were compatible with a depletion model, according to which incomplete "refill" after probabilistic quantal release entails release-site "emptying". For five neurons with 20 train repetitions at each frequency, there was little between-neuron variation of rundown; pool-refill rate increased with stimulus frequency and evolved during rundown. Covariances did not fit the depletion model or theoretical alternatives, being excessively negative for adjacent EPSCs early in trains, absent at equilibrium, and anomalously positive for some nonadjacent EPSCs. The anomalous covariances were unaltered during pharmacological blockade of receptor desensitization and saturation. These findings suggest that pool-refill rate and release probability at each release site are continually modulated by antecedent outputs in its neighborhood, possibly via feedback mechanisms. In all data sets, sampling errors for between-train variances were much less than theoretical, warranting reconsideration of the probabilistic nature of quantal transmitter release.


Figures

Figure 1
Figure 1
Examples of average corticothalamic EPSCs in trains (left) and a single train (right) at each stimulation frequency. Except at 20 Hz, some dead time between stimuli has been eliminated. Note jumps in EPSC amplitude visible in the averages, after the omitted 11th stimulus.
Figure 2
Figure 2
A single EPSC train at 20 Hz, inverted, and the same train after “deconvolution” to bring out the variability of time course of signals and visualization of “asynchronous” events.
Figure 3
Figure 3
(A) Covariance of continuous records with height of S1, S2,S3, and S4, respectively, under the average inverted original. Each signal-signal covariance is present at all relevant points. (B) Same records as in A, but deconvoluted. Note the relative brevity of signals. (C) Procedure similar to that in A, but only for covariances with height of S1. Data are from a neuron in cyclothiazide/kynurenate, which broadens EPSCs. (D) The same train set as in C, showing positive correlation across the omitted stimulus. Note the appearance of covariances despite there being only six trains.
Figure 4
Figure 4
(A) Scatterplots of S2 versus S1 for one neuron only at 2.5, 5, 10, and 20 Hz. The 30 pairings available in each are sufficient to see the negative correlations. (B) Using data from all five neurons, by normalizing each set of Ss by dividing by the means. The slope of the correlation between S2/〈S2〉 versus S1/〈S1〉 is −p/(1 − p), in the absence of refill, or less negative if refill is appreciable. The positive correlation of S3/〈S3〉 versus S1/〈S1〉 is contrary to theoretical expectation.
Figure 5
Figure 5
Various measured and derived release parameters. (A and C) Measured S1, S1/Sf, and derived parameters (vmf, Qt, Qc, and ratios) are given for each neuron. (B) Between-neuron variations for Qt/vmf and Qc/vmf ratios and SE/mean values.
Figure 6
Figure 6
(A) Evolution in trains of variance/mean ratios (vm). (Upper) Qc, cvm, and cvm′. Note that only Qc declines in the train. Data in A, main set: five neurons at four stimulus frequencies. (B and C) Averages from six neurons before treatment and with cyclothiazide/kynurenate at 10 Hz only, and with only six trains in each. The latter signals were measured as areas in deconvoluted records.
Figure 7
Figure 7
Analysis of amplitude of evoked and spontaneous “miniature” events. (A) Evoked (spike-triggered) asynchronous miniature events were sampled immediately after stimulus trains (poststimulation), whereas “spontaneous” miniature events were sampled before stimulus trains (prestimulation). (B) Histograms expressed as events/s before and after trains give histograms for events evoked by the trains of stimuli. (C) Bar graphs show means at the different frequencies for the five neurons, the coefficients of variation, to be compared with the QAs for the antecedent trains.
Figure 8
Figure 8
(A) Evolution of covariances in trains expressed as C(i,j) to permit averaging for the five neurons, with theoretical values for C(i,i + 1). For C(i,i + 2), all theoretical values are about half of those for C(i,i + 1), i.e., always negative, and only significant values are shown. (B) Same as in A, for the six neurons before and with cyclothiazide\kynurenate.
Figure 9
Figure 9
(A) Evolution of mean EPSC height in trains. Since values are expressed as a fraction of 〈S1〉 and quantal heights did not change in trains, these are also plots of quantal content as a fraction of that of the first signal. To avoid overlapping points, the values for successive stimulation frequencies are displaced downward. (B) Deviations from theoretical expectation for a constant p and α model.
Figure 10
Figure 10
(A) Plots of calculated α on the left and corresponding pool-refill rate, rα, on the right, calculated for each neuron at each stimulus frequency and then averaged, on the assumption of constant p. Note high early values and subsequent fall to a plateau, as well as dependence of rα on stimulus frequency. (B) Calculated p on the assumption of two different scenarios as to how α may be generated. See text for an explanation.
Figure 11
Figure 11
Sampling errors expressed as a coefficient of variation of Qt (A) and Qa (B), depending on how variances are measured (see text). There are two sets of controls, one generated by shifting the position of S in each train (shift stim no.) and the other by replacement of real data with Gaussian variates (normally distributed). The latter conform to theoretical expectation, whereas the real data does not.

References

    1. Hirst G.D., McLachlan E.M. Post-natal development of ganglia in the lower lumbar sympathetic chain of the rat. J. Physiol. 1984;349:119–134. - PMC - PubMed
    1. Abbott L.F., Varela J.A., Sen K., Nelson S.B. Synaptic depression and cortical gain control. Science. 1997;275:220–224. - PubMed
    1. Chen C., Blitz D.M., Regehr W.G. Contributions of receptor desensitization and saturation to plasticity at the retinogeniculate synapse. Neuron. 2002;33:779–788. - PubMed
    1. Liley A.W., North K.A. An electrical investigation of effects of repetitive stimulation on mammalian neuromuscular junction. J. Neurophysiol. 1953;16:509–527. - PubMed
    1. Elmqvist D., Quastel D.M. A quantitative study of end-plate potentials in isolated human muscle. J. Physiol. 1965;178:505–529. - PMC - PubMed

Publication types

LinkOut - more resources