. 2009 Mar;16(3):358-73.
doi: 10.1016/j.devcel.2009.01.012.

Neurogenin3 is sufficient for transdetermination of hepatic progenitor cells into neo-islets in vivo but not transdifferentiation of hepatocytes

Affiliations

Neurogenin3 is sufficient for transdetermination of hepatic progenitor cells into neo-islets in vivo but not transdifferentiation of hepatocytes

Vijay Yechoor et al. Dev Cell. 2009 Mar.

Abstract

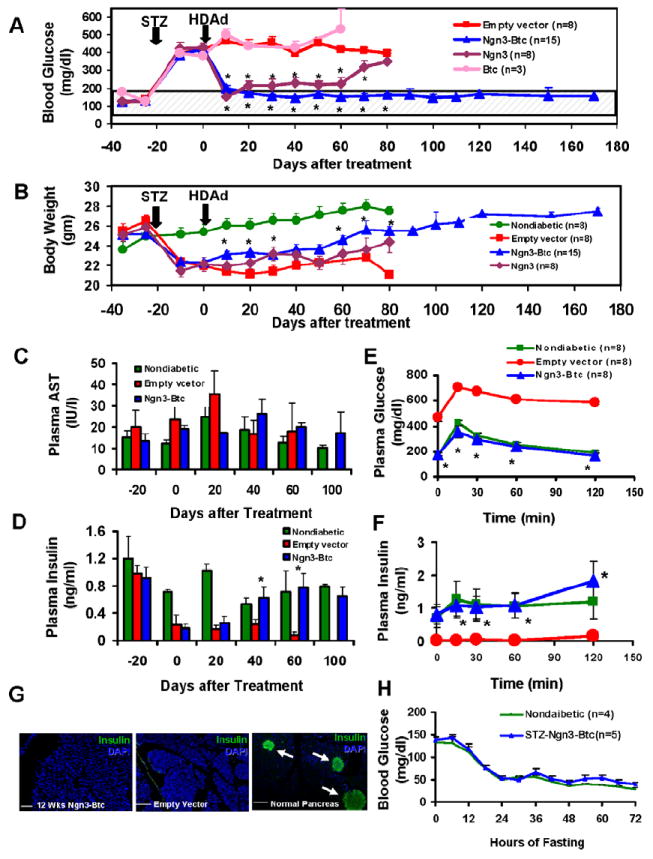
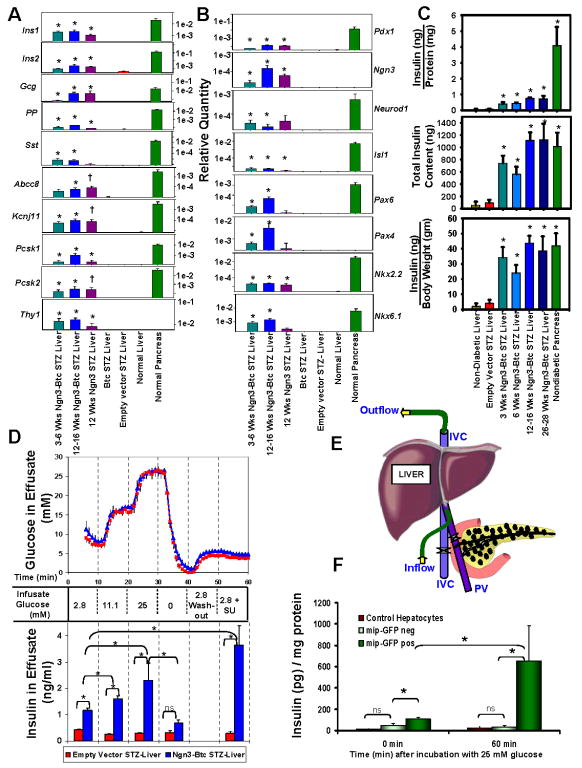
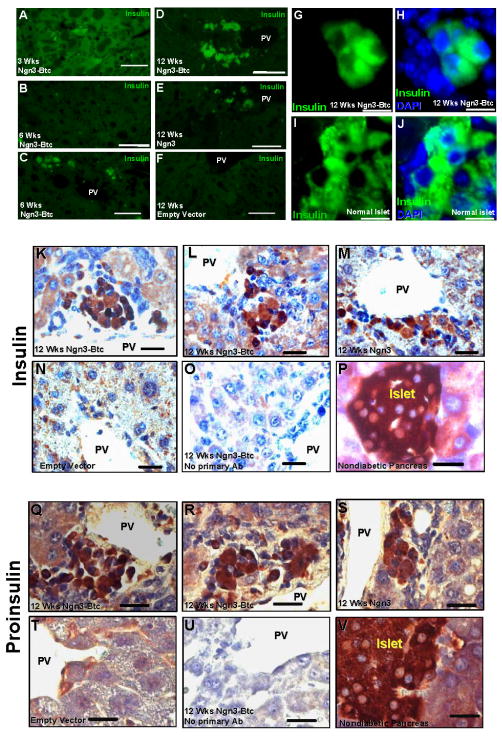
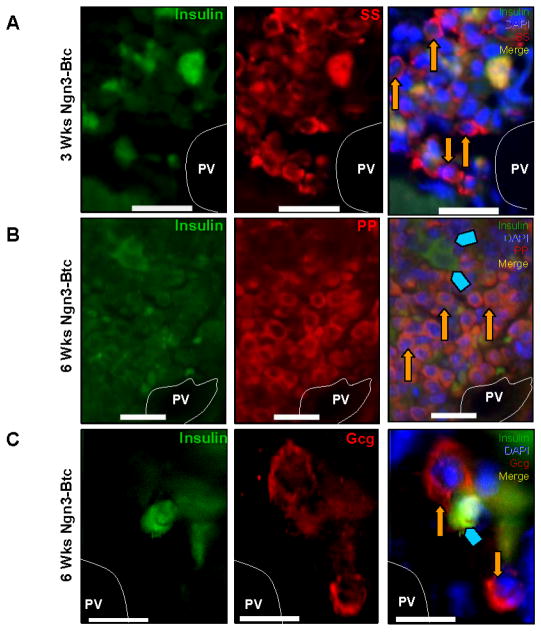
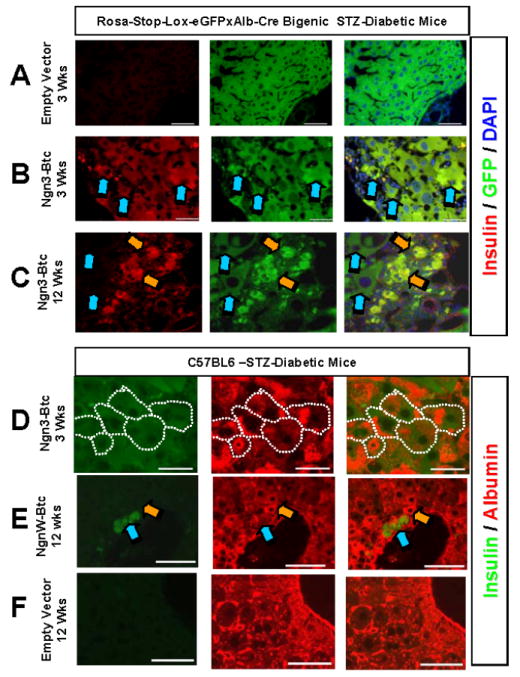
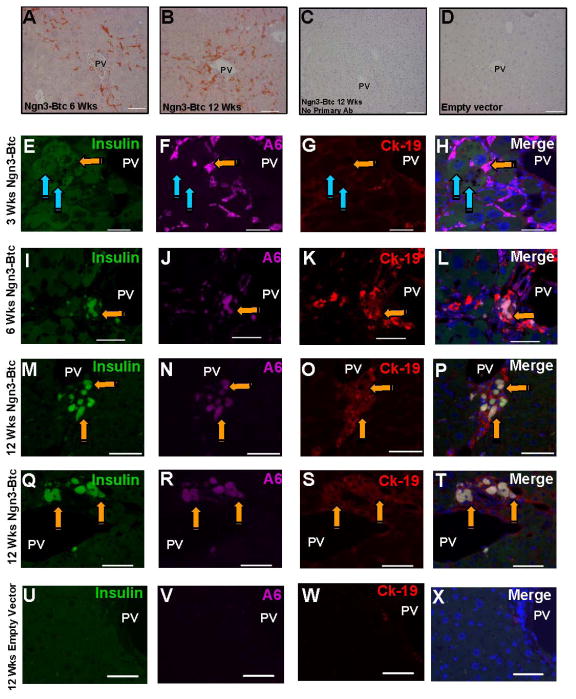
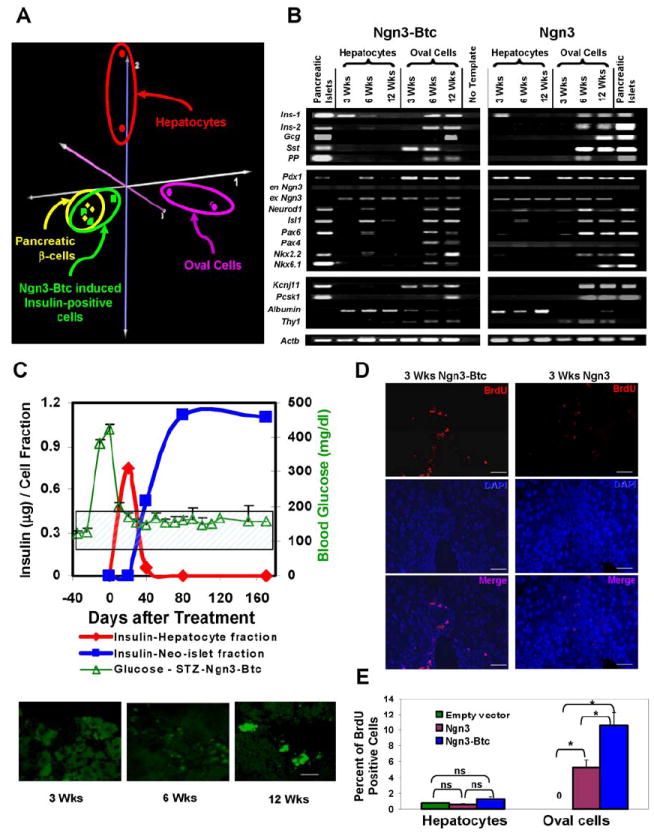
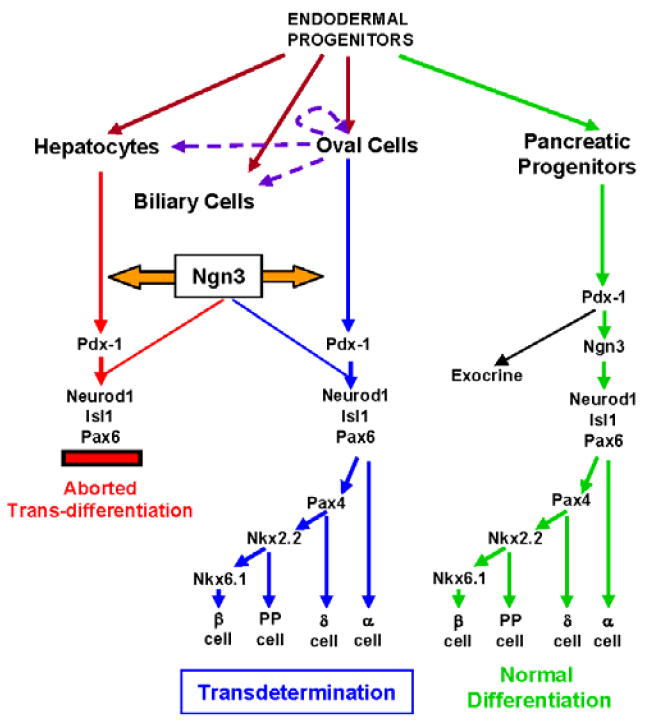
The transcription factor Neurogenin3 (Ngn3) is required for islet-cell type specification. Here, we show that hepatic gene transfer of Ngn3 transiently induces insulin in terminally differentiated hepatocytes but fails to transdifferentiate them, i.e., switch their lineage into islet cells. However, Ngn3 leads to long-term diabetes reversal in mice due to the emergence of periportal islet-like cell clusters. These neo-islets display glycemia-regulated insulin, beta-cell-specific transcripts, and an islet-specific transcription cascade, and they produce all four major islet hormones. They appear to arise from hepatic progenitor cells, most likely endoderm-derived oval cells. Thus, transfer of a single lineage-defining transcription factor, Ngn3, is sufficient to induce cell-lineage switching from a hepatic to an islet lineage in these progenitor cells, a process consistent with transdetermination, i.e, lineage switching in lineage-determined, but not terminally differentiated, cells. This paradigm of induced transdetermination of receptive progenitor cells in vivo may be generally applicable to therapeutic organogenesis for multiple diseases, including diabetes.


Figures

Figure 1
Figure 1. Ngn3-Btc reverses diabetes in insulin-deficient mice
A-B: Fasting blood glucose and body weight in STZ-diabetic mice. The hatched box covers the normal glucose range (mean ± 2 SD of 8 nondiabetic mice). C-D: Plasma aspartate aminotransferase (AST) and fasting insulin at indicated time points (n=4-5). E-F: Plasma glucose and insulin during an IP-GTT at 6 weeks after treatment. G: Representative pancreas sections of STZ-diabetic mice treated with either Ngn3-Btc or empty vector are shown along with nondiabetic control by insulin IF (green) and by DAPI nuclear stain (blue). Scale bars represent 100μm. H: Blood glucose during a 72 h fast in Ngn3-Btc-treated diabetic and nondiabetic control mice. All values are mean±SEM; * p≤0.05
Figure 2
Figure 2. Ngn3-Btc induces regulated insulin production from the liver
A-B: Quantitative RT-PCR for islet hormones, proteins (A), and transcription factors involved in islet development (B) from the livers of treated mice (n=3-5). Values are expressed after normalization relative to GAPDH and eEF1γ. C: Liver insulin content (ng) per mg protein (upper panel), normalized to the whole organ weight (middle panel) and to the body weight (lower panel) (n=3-4). D-E: Glucose-stimulated insulin secretion (GSIS) from the livers of Ngn3-Btc-treated and empty vector treated diabetic mice (n=3-4), 6-8 weeks after treatment, by in situ liver perfusion (Schematic drawing in E). Glucose (upper panel) and insulin (lower panel) in effusate are shown at indicated infused glucose concentrations. SU-sulfonylurea (10nM Glibenclamide). F: GSIS from GFP-negative and GFP-positive cells from Ngn3-Btc-treated mip-GFP diabetic mouse livers, 6-8 weeks after treatment and control hepatocytes are from nondiabetic mouse livers (n=3 each) All values are mean±SEM; * p≤0.05; † p=0.057; ns-not significant
Figure 3
Figure 3. Ngn3-Btc induces two waves of insulin expression – first in parenchymal hepatocytes and later in periportal neo-islets
A-F: Representative sections of STZ-diabetic mouse liver stained for insulin (green) by immunofluorescence (IF). Ngn3-Btc induces insulin expression in the parenchymal hepatocytes at 3 weeks (A) which fades by 6 weeks (B), at which time periportal clusters of strongly insulin-positive cells appear (C) which increase in number and intensity by 12 weeks (D). Ngn3-only treatment is sufficient to induce periportal insulin positive clusters (E), though fewer in number as compared to treatment with Ngn3+Btc (D). No insulin IF is seen in the empty vector STZ-diabetic control (F). G-J: Higher magnification of the periportal insulin-positive cluster (G-H); an islet from a nondiabetic control pancreas (I-J) is shown for comparison. G&I are stained for insulin (green) and H&J are merged with DAPI (blue). K-P: Periportal clusters of insulin-positive cells in Ngn3-Btc (K, L) and Ngn3-only (M) treated diabetic livers; none are seen with empty vector treatment (N). No primary antibody control (O) and an islet from a nondiabetic mouse pancreas (P) are shown for reference. Q-V: Periportal clusters of proinsulin-positive cells in Ngn3-Btc (Q, R) and Ngn3-only (S) treated diabetic livers; none are seen with empty vector treatment (T). No primary antibody control (U) and an islet from a nondiabetic mouse pancreas (V) are shown for reference. Scale bar represents 20μm. PV, Portal vein
Figure 4
Figure 4. Ngn3-Btc-induced neo-islets express individual islet hormones
A-C: Representative sections of Ngn3-Btc treated STZ-diabetic mouse liver stained by IF for insulin – left panels; pancreatic polypeptide (PP), somatostatin (SS) or glucagon (Gcg) - middle panels; or merged images - right panels. Individual hormone-producing cells can be seen for each of the hormones (blue arrows for insulin and orange arrows for others). Scale bar represents 20μm in A-B and 10μm in C.
Figure 5
Figure 5. Lineage tracing demonstrates that cells expressing the first wave of insulin come from hepatocytes and the second wave from periportal oval cells
A-C: Representative sections of STZ-diabetic bi-genic (Rosa26-Stop-Lox-eGFP × Albumin-Cre) mouse liver stained for insulin (left panel) and GFP (middle panel) or merged with DAPI (right panel). Green GFP staining indicates albumin-expressing lineage cells. Of note, the parenchymal hepatocytes co-express insulin and GFP at 3 weeks (B, blue arrows), but no insulin is seen in these GFP-positive hepatocytes at 12 weeks (C, blue arrows). The neo-islets (C, orange arrows) co-express insulin and GFP. D-F: Representative sections of STZ-diabetic wild type C57/BL6 mouse liver immunostained for insulin and albumin treated with Ngn3-Btc or empty vector. All parenchymal hepatocyte expressing insulin in panel D (left) also co-express immunoreactive albumin (middle) in the same cell though to varying degrees as seen in the outlined cells, while the insulin-expressing neo-islets in panel E do not. Orange arrow points to albumin-only expressing cell, while the blue arrow points to an insulin-only producing cell. Scale bar represents 50μm.
Figure 6
Figure 6. Ngn3-Btc-induced periportal neo-islets originate from oval cells
A-D: Periportal clusters of orange-red staining A6 positive oval cells by immunohistochemistry in Ngn3-Btc treated diabetic livers (A-B), but none with empty vector-treatment (D). No primary antibody control (C) is shown for reference. Scale bar represents 50μm. PV, Portal vein. E-X: Representative sections of Ngn3-Btc (E-T) and empty vector (U-X) treated STZ-diabetic mouse livers - immunostained for insulin (green – left panels E, I, M, Q, U), oval-specific antigen A6 (pseudo-colored magenta – panels F, J, N, R, V), CK-19, an oval cell and biliary epithelial antigen (red – panels G, K, O, S, W) and the merged images with DAPI (right panels – H, L, P, T, X). Insulin positive hepatocytes do not co-express A6 or CK-19 (blue arrows). Oval cells do not co-express insulin at 3 weeks after Ngn3-Btc (E-H orange arrows), but do so at later time points (I-T, orange arrows). No insulin or A6 positive cell is seen with empty vector treatment, while CK-19 positive biliary cells are seen as expected. (U-X). Scale bar represents 50μm.
Figure 7
Figure 7. Ngn3 induces islet neogenesis via transdetermination of oval cells and not transdifferentiation of hepatocytes
A: Correspondence Analysis reveals that the Ngn3-Btc-induced insulin-positive cells cluster with mature pancreatic β-cells much more closely than with chemical diet-induced oval cells or normal hepatocytes (details in Supplemental Text). B: RT-PCR of LCM- RNA from Ngn3-Btc (left) and Ngn3-only (right) treated STZ-diabetic mouse livers and from nondiabetic pancreatic islets. All are 40 cycles except for Ins1, Ins2, Albumin and Actb (32 cycles). C: Estimated insulin content of the parenchymal hepatocyte and the neo-islet fractions (left Y-axis) and the blood glucose of the Ngn3-Btc-treated group (right Y-axis) and normal range (hatched area) (from Fig. 1A). Note the concordance of the estimated insulin content (upper panel) with the insulin immunostaining predominantly in the parenchymal hepatocytes at 3 weeks and in the periportal neo-islets at 12 weeks (lower panels). D-E: BrdU staining (D) shows significant proliferative activity in the periportal oval cells as compared to the neighboring hepatocytes more so with Ngn3-Btc (left) than with Ngn3-only (right) 3 weeks after treatment. The quantitation of BrdU labeling is shown (E).
Figure 8
Figure 8. Model for Ngn3-induced transdetermination of hepatic oval cells
Ngn3 induces transdetermination in oval cells (in blue) and an aborted transdifferentiation in Ngn3-transduced parenchymal hepatocytes (in red). Normal islet differentiation cascade is also shown (in green). Normally, oval cells give rise to hepatocytes and biliary cells (interrupted lines). The origin of hepatocytes and biliary cells from the common endodermal progenitors is also shown (in brown).

References

    1. Apelqvist A, Li H, Sommer L, Beatus P, Anderson DJ, Honjo T, Hrabe de AM, Lendahl U, Edlund H. Notch signalling controls pancreatic cell differentiation. Nature. 1999;400:877–881. - PubMed
    1. Ber I, Shternhall K, Perl S, Ohanuna Z, Goldberg I, Barshack I, Benvenisti-Zarum L, Meivar-Levy I, Ferber S. Functional, persistent, and extended liver to pancreas transdifferentiation. J Biol Chem. 2003;278:31950–31957. - PubMed
    1. Brun T, He KH, Lupi R, Boehm B, Wojtusciszyn A, Sauter N, Donath M, Marchetti P, Maedler K, Gauthier BR. The diabetes-linked transcription factor Pax4 is expressed in human pancreatic islets and is activated by mitogens and GLP-1. Hum Mol Genet. 2008;17:478–489. - PubMed
    1. Cascio S, Zaret KS. Hepatocyte differentiation initiates during endodermal-mesenchymal interactions prior to liver formation. Development. 1991;113:217–225. - PubMed
    1. Collombat P, Hecksher-Sorensen J, Serup P, Mansouri A. Specifying pancreatic endocrine cell fates. Mech Dev. 2006;123:501–512. - PubMed

Publication types

MeSH terms