. 2009:455:299-327.
doi: 10.1016/S0076-6879(08)04211-0.

Energetic profiling of protein folds

Affiliations

Energetic profiling of protein folds

Jason Vertrees et al. Methods Enzymol. 2009.

Abstract

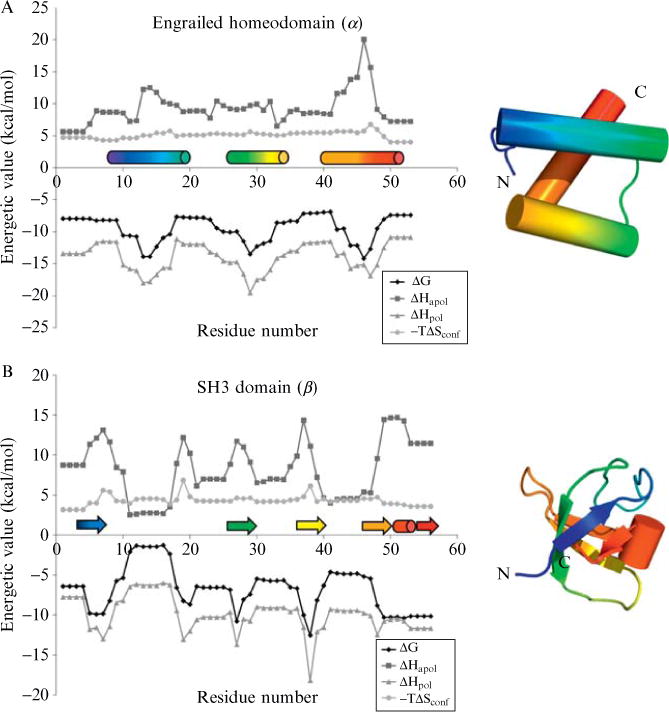
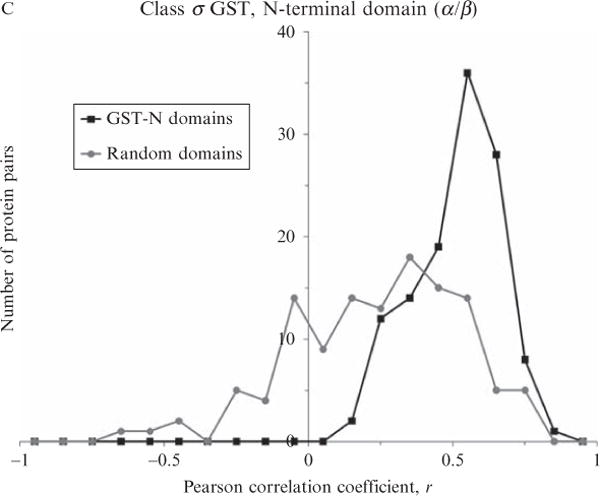
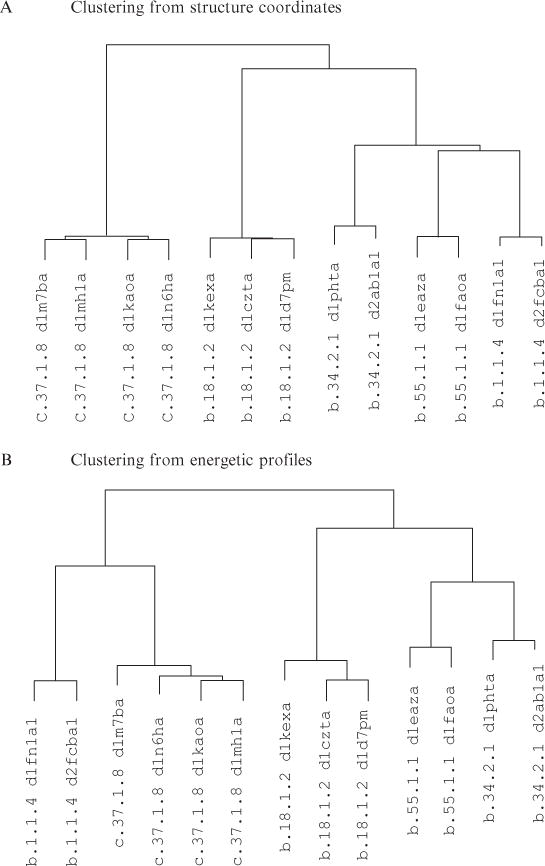
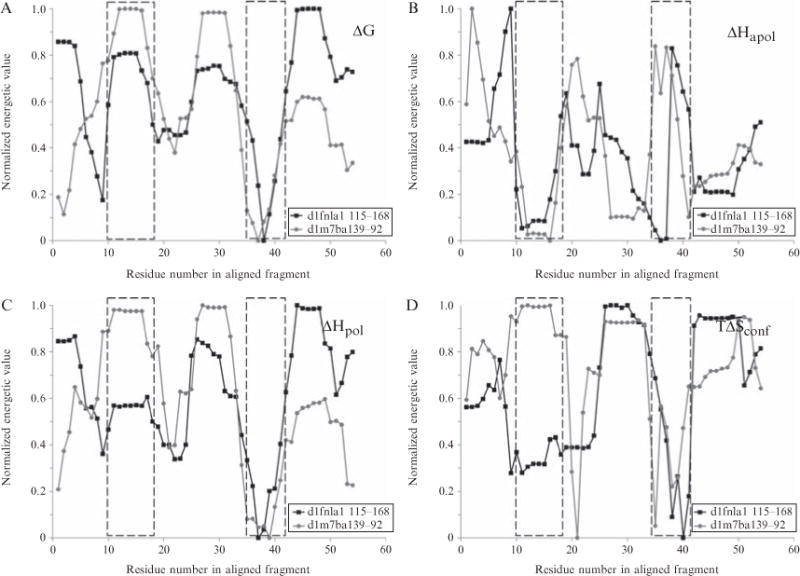
Current protein classification methods treat high-resolution structures as static entities. However, experiments have well documented the dynamic nature of proteins. With knowledge that thermodynamic fluctuations around the high-resolution structure contribute to a more physically accurate and biologically meaningful picture of a protein, the concept of a protein's energetic profile is introduced. It is demonstrated on a large scale that energetic profiles are both diagnostic of a protein fold and evolutionarily relevant. Development of Structural Thermodynamic Ensemble-based Protein Homology (STEPH), an algorithm that searches for local similarities between energetic profiles, constitutes a first step towards a long-term goal of our laboratory to integrate thermodynamic information into protein-fold classification approaches.


Figures

Figure 11.1
Figure 11.1
Energetic profiles of three diverse protein structures. These profiles consist of local stability (ΔG), apolar solvation enthalpy (ΔHapol), polar solvation enthalpy (ΔHpol), and conformational entropy (−TΔSconf). The COREX algorithm (window size 5 residues, minimum window-size 4 residues, entropy weighting factor 0.5, simulated pH of 7.0, temperature 25.°C) was run on three proteins: (A) drosophila engrailed homeodomain (PDB code 1p7iA, SCOP sid d1p7ia, SCOP structural class all-alpha, a.4.1.1), (B) mouse SH3 domain (PDB code 1ckaA, SCOP sid d1ckaa1, SCOP structural class all-beta, b.34.2.1), (C) human class sigma glutathione S-transferase, N-terminal domain (PDB code 1iyhA, SCOP sid d1iyha2, SCOP structural class alpha/beta, c.47.1.5). DSSP secondary structure(Kabsch and Sander, 1983) is indicated immediately above the x-axis, helices as cylinders and strands as arrows. Rainbow colors indicate progression from N to C terminus to aid in the reader’s mapping of locations along the primary sequence to locations in the tertiary structure. All energetic values vary as a function of location in the protein structure, a result observed by experiment but not anticipated by treatment of the structure as a rigid entity.
Figure 11.1
Figure 11.1
Energetic profiles of three diverse protein structures. These profiles consist of local stability (ΔG), apolar solvation enthalpy (ΔHapol), polar solvation enthalpy (ΔHpol), and conformational entropy (−TΔSconf). The COREX algorithm (window size 5 residues, minimum window-size 4 residues, entropy weighting factor 0.5, simulated pH of 7.0, temperature 25.°C) was run on three proteins: (A) drosophila engrailed homeodomain (PDB code 1p7iA, SCOP sid d1p7ia, SCOP structural class all-alpha, a.4.1.1), (B) mouse SH3 domain (PDB code 1ckaA, SCOP sid d1ckaa1, SCOP structural class all-beta, b.34.2.1), (C) human class sigma glutathione S-transferase, N-terminal domain (PDB code 1iyhA, SCOP sid d1iyha2, SCOP structural class alpha/beta, c.47.1.5). DSSP secondary structure(Kabsch and Sander, 1983) is indicated immediately above the x-axis, helices as cylinders and strands as arrows. Rainbow colors indicate progression from N to C terminus to aid in the reader’s mapping of locations along the primary sequence to locations in the tertiary structure. All energetic values vary as a function of location in the protein structure, a result observed by experiment but not anticipated by treatment of the structure as a rigid entity.
Figure 11.2
Figure 11.2
Variance of four-dimensional energetic profile space explained by principal components. Percentage variance of each principal component (i.e., eigenvalue in Table 11.1) is displayed. Clearly the first principal component accounts for the majority of variance and the first two components account for almost all variance. Therefore, subsequent energetic profiles may be greatly simplified by using only the first component instead of the four thermodynamic quantities ΔG, ΔHapol, ΔHpol, and TΔSconf.
Figure 11.3
Figure 11.3
Principal components transformed energetic profiles of three diverse protein structures. Energetic profiles of the structures of Fig. 11.1 are displayed as three transformed datasets, derived from the four thermodynamic quantities in Fig. 11.1 and transformed by the first three eigenvectors of Table 11.1.
Figure 11.3
Figure 11.3
Principal components transformed energetic profiles of three diverse protein structures. Energetic profiles of the structures of Fig. 11.1 are displayed as three transformed datasets, derived from the four thermodynamic quantities in Fig. 11.1 and transformed by the first three eigenvectors of Table 11.1.
Figure 11.4
Figure 11.4
Probability densities of Pearson correlations of energetic profiles between homologous and nonhomologous proteins. 1866 protein domains of 100 residues or less were taken from the ASTRAL 1.69 database of 40% maximum sequence identity representatives (Chandonia et al., 2004); this set constitutes an arguably exhaustive sampling of known fold space. The domains were structurally aligned using DALI (Holm and Park, 2000) in an all-versus-all fashion (Fig. 11.4A, inset; the example shows a homologous engrailed homeodomain pair superimposed with an RMSD of 1.5 Å according to the DALI alignment). Then, energetic profiles were computed for each domain using COREX (run under the parameters listed in the Fig. 11.1 legend) and the first eigenvalue given in Table 11.1 was used to transform each four-dimensional profile into one-dimensional principal component space. First principal components from each member of all possible pairs of proteins were equivalenced according to the DALI structure alignment (Fig. 11.4A) and a Pearson linear correlation coefficient, r, was computed for each pair (Fig. 11.4B). The first and last four residues in each energetic profile, if part of the structural alignment, were ignored in the correlation because of sliding window end effects in the COREX algorithm. To reduce noise in the correlations, only pairs of proteins with resolutions less than 2.5 Å and structure alignments greater than 20 residues were considered. The densities of correlations corresponding to homologous and nonhomologous protein pairs (as defined by belonging to the same SCOP family or different SCOP secondary structure classes, respectively) were normalized such that their total areas equaled 1 (Fig. 11.4C). There were a total of 3715 homologous pairs and 547,600 nonhomologous pairs analyzed. Clearly, homologous protein pairs exhibited similar energetic profiles, as the median correlation between energetic profiles of homologous proteins was approximately r = 0.6, and the median correlation for nonhomologs was approximately r = 0.3.
Figure 11.4
Figure 11.4
Probability densities of Pearson correlations of energetic profiles between homologous and nonhomologous proteins. 1866 protein domains of 100 residues or less were taken from the ASTRAL 1.69 database of 40% maximum sequence identity representatives (Chandonia et al., 2004); this set constitutes an arguably exhaustive sampling of known fold space. The domains were structurally aligned using DALI (Holm and Park, 2000) in an all-versus-all fashion (Fig. 11.4A, inset; the example shows a homologous engrailed homeodomain pair superimposed with an RMSD of 1.5 Å according to the DALI alignment). Then, energetic profiles were computed for each domain using COREX (run under the parameters listed in the Fig. 11.1 legend) and the first eigenvalue given in Table 11.1 was used to transform each four-dimensional profile into one-dimensional principal component space. First principal components from each member of all possible pairs of proteins were equivalenced according to the DALI structure alignment (Fig. 11.4A) and a Pearson linear correlation coefficient, r, was computed for each pair (Fig. 11.4B). The first and last four residues in each energetic profile, if part of the structural alignment, were ignored in the correlation because of sliding window end effects in the COREX algorithm. To reduce noise in the correlations, only pairs of proteins with resolutions less than 2.5 Å and structure alignments greater than 20 residues were considered. The densities of correlations corresponding to homologous and nonhomologous protein pairs (as defined by belonging to the same SCOP family or different SCOP secondary structure classes, respectively) were normalized such that their total areas equaled 1 (Fig. 11.4C). There were a total of 3715 homologous pairs and 547,600 nonhomologous pairs analyzed. Clearly, homologous protein pairs exhibited similar energetic profiles, as the median correlation between energetic profiles of homologous proteins was approximately r = 0.6, and the median correlation for nonhomologs was approximately r = 0.3.
Figure 11.5
Figure 11.5
Distributions of Pearson correlations of energetic profiles within three protein-fold families. All domains (≤100 residues) of three SCOP families contained in the ASTRAL 1.69 40% representatives database were extracted: homeodomain (a.4.1.1, 11 members), SH3-domains (b.34.2.1, 29 members), glutathione S-transferase, N-terminal domain (c.47.1.5, 16 members). Each family was subjected to multiple sequence alignment using PROMALS3D (Pei et al., 2008). A randomly chosen set of nonhomologous domains, equal in members and chain lengths, was also multiply aligned as a control for each family. Then, pairwise Pearson correlation coefficients were computed in an all-versus-all fashion for each family and control, as described in the Fig. 11.4 legend. Distributions of these correlations clearly demonstrated that energetic profiles were similar within protein families. Median correlation coefficients for all families were greater than r = 0.6, and median correlations for all unrelated proteins in the control alignments were less than r = 0.3.
Figure 11.5
Figure 11.5
Distributions of Pearson correlations of energetic profiles within three protein-fold families. All domains (≤100 residues) of three SCOP families contained in the ASTRAL 1.69 40% representatives database were extracted: homeodomain (a.4.1.1, 11 members), SH3-domains (b.34.2.1, 29 members), glutathione S-transferase, N-terminal domain (c.47.1.5, 16 members). Each family was subjected to multiple sequence alignment using PROMALS3D (Pei et al., 2008). A randomly chosen set of nonhomologous domains, equal in members and chain lengths, was also multiply aligned as a control for each family. Then, pairwise Pearson correlation coefficients were computed in an all-versus-all fashion for each family and control, as described in the Fig. 11.4 legend. Distributions of these correlations clearly demonstrated that energetic profiles were similar within protein families. Median correlation coefficients for all families were greater than r = 0.6, and median correlations for all unrelated proteins in the control alignments were less than r = 0.3.
Figure 11.6
Figure 11.6
Cluster trees built from either structure coordinates or energetic profiles of five homologous protein-fold families. Protein domains were contained in our previously studied human protein thermodynamic database (Larson and Hilser, 2004). SCOP families represented are G proteins (c.37.1.8), discoidin (b.18.1.2), SH3 domains (b.34.2.1), Pleckstrin-homology domains (b.55.1.1), and I set domains (b.1.1.4). Trees were built using agglomerative hierarchical clustering, as described in text, with input data from CE structure alignments or STEPH, our variant of CE, energetic profile alignments. (A) Clustering from three-dimensional structure coordinates. SCOP families are clearly segregated with all-beta proteins on a separate branch from the alpha/beta proteins. (B) Clustering from three-dimensional energetic profiles. SCOP families are again properly segregated but the I set domains have moved to the alpha/beta branch, for thermodynamic reasons described in the text.
Figure 11.7
Figure 11.7
Energetic profiles of two fragments of STEPH aligned nonhomologous proteins. A subset of 54 residues from the complete energetic alignment is shown: residues 115–168 (PDB numbering) of d1fnla1 and residues 39-92 (PDB numbering) of d1m7ba1. The aligned subset has been renumbered starting from 1. For clarity, the principal components transformed profiles are displayed as the original four energetic quantities: (A) local stability (ΔG), (B) apolar solvation enthalpy (ΔHapol), (C) polar solvation enthalpy (ΔHpol), and D. conformational entropy (TΔSconf). Energetic profiles are normalized so that minimum values within each protein equal 0 and maximum values equal 1. Regions 10–18 and 35–42, discussed in text, are boxed in each panel.
Figure 11.8
Figure 11.8
Molecular rationalization of STEPH aligned fragments of nonhomologous proteins. Fragments of d1fnla (PDB 1fnlA residues 115–168) and d1m7ba1 (PDB 1m7bA residues 39–92) as energetically aligned by STEPH are displayed in green and light blue, respectively. Renumbered residues 10–18 of the 1m7bA aligned fragment discussed in the text are displayed in yellow, with apolar solvent exposed side chains explicitly shown.
Figure 11.9
Figure 11.9
Structurally similar regions of two nonhomologous proteins revealed by alignment of energetic profiles. Two structurally similar regions of 24 residues each, determined to be energetically similar from STEPH alignment as discussed in the text, are highlighted in red (d1fnla1) and yellow (d1m7ba). The remainders of both proteins are displayed in blue.

Similar articles

Cited by

References

    1. Alva V, Koretke KK, Coles M, Lupas AN. Cradle-loop barrels and the concept of metafolds in protein classification by natural descent. Curr Opin Struct Biol. 2008;18:358–365. - PubMed
    1. Babu CR, Hilser VJ, Wand AJ. Direct access to the cooperative substructure of proteins and the protein ensemble via cold denaturation. Nat Struct Mol Biol. 2004;11:352–357. - PubMed
    1. Chandonia JM, Hon G, Walker NS, Lo Conte L, Koehl P, Levitt M, Brenner SE. The ASTRAL compendium in 2004. Nucleic Acids Res. 2004;32:D189–D192. - PMC - PubMed
    1. Chen L, Zhou T, Tang Y. Protein structure alignment by deterministic annealing. Bioinformatics. 2005;21:51–62. - PubMed
    1. Day R, Beck DA, Armen RS, Daggett V. A consensus view of fold space: Combining SCOP, CATH, and the Dali Domain Dictionary. Protein Sci. 2003;12:2150–2160. - PMC - PubMed

Publication types

LinkOut - more resources