. 2009 May 15;284(20):13434-13445.
doi: 10.1074/jbc.M806554200. Epub 2009 Mar 16.

Protein kinase D mediates mitogenic signaling by Gq-coupled receptors through protein kinase C-independent regulation of activation loop Ser744 and Ser748 phosphorylation

Affiliations

Protein kinase D mediates mitogenic signaling by Gq-coupled receptors through protein kinase C-independent regulation of activation loop Ser744 and Ser748 phosphorylation

James Sinnett-Smith et al. J Biol Chem. .

Abstract

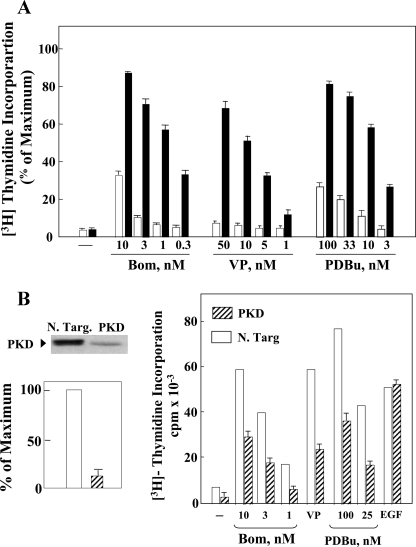
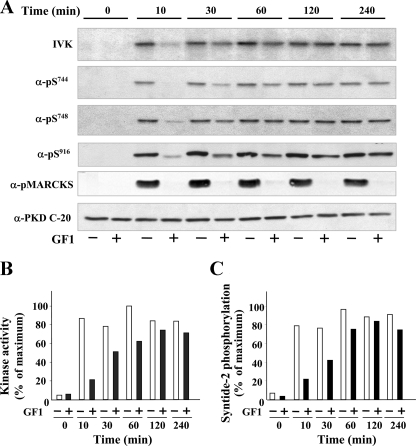
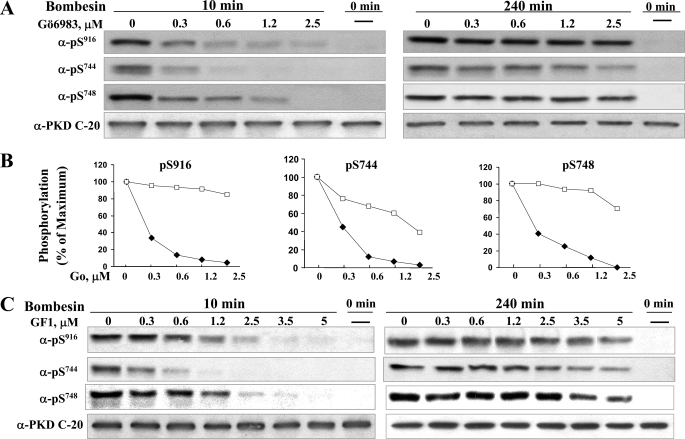
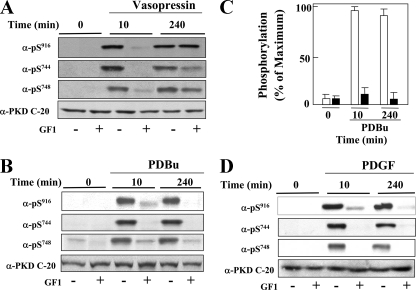
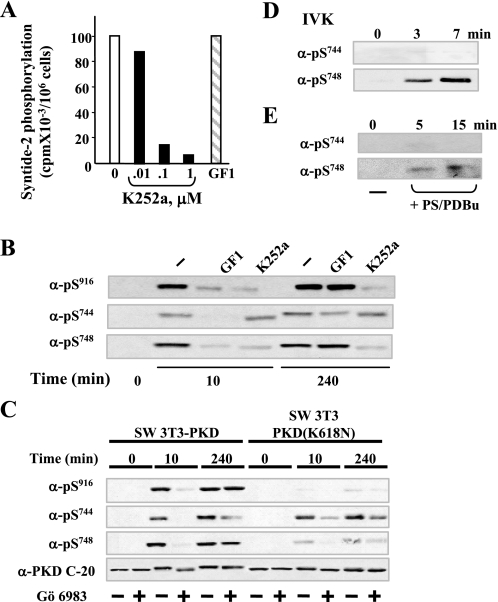
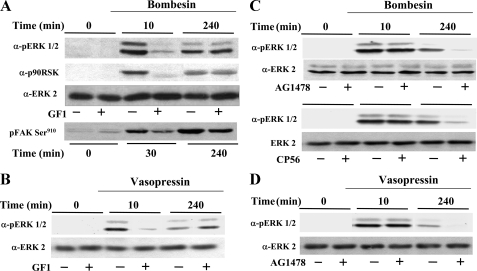
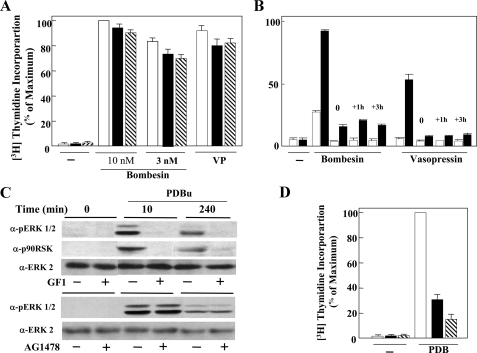
Rapid protein kinase D (PKD) activation and phosphorylation via protein kinase C (PKC) have been extensively documented in many cell types cells stimulated by multiple stimuli. In contrast, little is known about the role and mechanism(s) of a recently identified sustained phase of PKD activation in response to G protein-coupled receptor agonists. To elucidate the role of biphasic PKD activation, we used Swiss 3T3 cells because PKD expression in these cells potently enhanced duration of ERK activation and DNA synthesis in response to G(q)-coupled receptor agonists. Cell treatment with the preferential PKC inhibitors GF109203X or Gö6983 profoundly inhibited PKD activation induced by bombesin stimulation for <15 min but did not prevent PKD catalytic activation induced by bombesin stimulation for longer times (>60 min). The existence of sequential PKC-dependent and PKC-independent PKD activation was demonstrated in 3T3 cells stimulated with various concentrations of bombesin (0.3-10 nm) or with vasopressin, a different G(q)-coupled receptor agonist. To gain insight into the mechanisms involved, we determined the phosphorylation state of the activation loop residues Ser(744) and Ser(748). Transphosphorylation targeted Ser(744), whereas autophosphorylation was the predominant mechanism for Ser(748) in cells stimulated with G(q)-coupled receptor agonists. We next determined which phase of PKD activation is responsible for promoting enhanced ERK activation and DNA synthesis in response to G(q)-coupled receptor agonists. We show, for the first time, that the PKC-independent phase of PKD activation mediates prolonged ERK signaling and progression to DNA synthesis in response to bombesin or vasopressin through a pathway that requires epidermal growth factor receptor-tyrosine kinase activity. Thus, our results identify a novel mechanism of G(q)-coupled receptor-induced mitogenesis mediated by sustained PKD activation through a PKC-independent pathway.


Figures

FIGURE 1.
FIGURE 1.
Panel A, PKD overexpression selectively potentiates DNA synthesis induced by bombesin, vasopressin, and PDBu in Swiss 3T3 cells. Confluent and quiescent cultures of Swiss 3T3 PKD.GFP cells (solid bars) and Swiss 3T3 GFP cells (open bars) were washed and incubated at 37 °C in 2 ml of DMEM/Waymouth's medium containing [3H]thymidine and the growth-promoting factors bombesin (Bom), vasopressin (VP), or PDBu, at the indicated concentrations. Results are expressed as a percentage mean ± S.E. (n = 3) of the maximal stimulation obtained with 10% fetal bovine serum (110 × 10–3 cpm/culture). Panel B, knockdown of endogenous PKD attenuates DNA synthesis in response to bombesin, vasopressin, or PDBu. Left, Swiss 3T3 cells were transfected with either non-targeting negative control (N. Targ.) or 75 nm PKD siRNA (PKD) as indicated. The cells were lysed, and PKD protein expression was assessed by Western blotting using the anti-PKD C-20 antibody. Shown here is are representative autoluminogram; similar results were obtained in four independent experiments. Autoluminograms were quantified by densitometric scanning. The results shown are the mean ± S.E. n = 4 and are expressed as percentage of the maximum level of PKD in non-targeting negative control cells (open bars). PKD expression was reduced by 88–92% (hatched bars). Right, Swiss 3T3 cells were transfected with either non-targeting negative control (open bars) or 75 nm PKD siRNA (hatched bars). After 6 days, when the cells were confluent and quiescent, the cultures were washed and incubated at 37 °C in 2 ml of DMEM/Waymouth's medium containing [3H]thymidine and the growth-promoting factors bombesin (Bom), 50 nm vasopressin (VP), and PDBu. Results are expressed as cpm/culture × 10–3; maximal stimulation, obtained in parallel cultures by stimulating with 10% fetal bovine serum, was 110 × 10–3 cpm/culture.
FIGURE 2.
FIGURE 2.
Time-course of bombesin-induced PKD phosphorylation and catalytic activation. Swiss 3T3 PKD.GFP cells were incubated in the absence (–, open bars) or in the presence (+, filled bars) of 3.5 μm GF1 for 1 h before stimulation of the cells with 10 nm bombesin for the indicated times. Panel A, the cultures were lysed with 2×SDS-PAGE sample buffer and analyzed by SDS-PAGE and immunoblotting with the following antibodies: phospho PKD Ser(P)916, Ser(P)744, Ser(P)748, and phospho-MARCKS. Equivalent loading of the gel was verified using Western blot analysis with an antibody directed against the C-terminal region of PKD (PKD-C20). Shown here are representative autoluminograms; similar results were obtained in five independent experiments. Quantification of 8 independent experiments carried out after 10 or 240 min of bombesin stimulation are shown in the supplemental data. Panel A, in vitro kinase. For IVK activity the cultures were lysed in ice-cold buffer, and PKD was immunoprecipitated from lysates with an anti-PKD (C-20) antibody bound to protein A-agarose and assayed for autophosphorylation, as described under “Experimental Procedures.” Shown here is a representative autoradiograph (IVK). Panel B, autoradiographs (IVK) were quantified by densitometric scanning. The results shown are the mean ± S.E. (n = 3) and are expressed as percentage of the maximum increase induced by treatment with bombesin. Panel C, PKD activity was measured by syntide-2 phosphorylation in immune complexes from lysates of cells that were incubated in the presence (filled bars) or in the absence (open bars) of 3.5 μm GF109203X for 1 h before stimulation with bombesin for the indicated times. The values shown (mean ± S.E. of at least two independent experiments) are expressed as percentage of the maximum increase induced by bombesin.
FIGURE 3.
FIGURE 3.
Effect of increasing concentrations of Gö6983 or GF1 on PKD phosphorylation on Ser916, Ser744, and Ser748 induced by bombesin stimulation for either 10 or 240 min. Swiss 3T3 PKD.GFP cells were incubated in the absence (–) or in the presence (+) of increasing concentrations of Gö6983 for 1 h before stimulation of the cells with 10 nm bombesin for either 10 min or 240 min as indicated and then lysed with 2×SDS-PAGE sample buffer. A, the samples were analyzed by SDS-PAGE and immunoblotting with the antibodies phospho-PKD Ser(P)916, Ser(P)744, Ser(P)748, and PKD-C20 to verify equal loading. Shown here are representative autoluminograms; similar results were obtained in three independent experiments. B, autoluminograms were quantified by densitometric scanning. The results shown are the mean ± S.E. (n = 3) and are expressed as the percentage of the maximum increase induced by treatment with bombesin in cells preincubated in the absence (open symbols) or the presence (closed symbols) of Gö6983. C, Swiss 3T3 PKD.GFP cells were incubated in the absence (–) or in the presence (+) of increasing concentrations of GF1 for 1 h before stimulation of the cells with 10 nm bombesin for 10 min or 240 min as indicated and then lysed with 2×SDS-PAGE sample buffer. The samples were analyzed by SDS-PAGE and immunoblotting with phospho PKD Ser(P)916, Ser(P)744, Ser(P)748 and PKD-C20 to verify equal loading. Shown here are representative autoluminograms; similar results were obtained in three independent experiments.
FIGURE 4.
FIGURE 4.
PKC-dependent and PKC-independent PKD activation in cells stimulated with vasopressin, PDBu, and PDGF. Swiss 3T3 PKD.GFP cells were incubated in the presence (+) or in the absence (–) of 3.5 μm GF1 for 1 h before stimulation with 50 nm vasopressin (panel A), 100 nm PDBu (panels B and C) or 10 ng/ml PDGF (panel D) for either 10 or 240 min as indicated. The cultures were then lysed with 2× SDS-PAGE sample buffer and analyzed by SDS-PAGE and immunoblotting with the antibodies phospho-PKD Ser(P)916, Ser(P)744, Ser(P)748, and PKD-C20 to verify equal loading. The results shown here are representative autoluminograms; similar results were obtained in at least three independent experiments. Panel C, quantification by densitometric scanning of Ser916 phosphorylation. The results shown are the means ± S.E. (n = 20) and are expressed as the percentage of the maximum increase induced by treatment with PDBu in cells treated in the absence (open bars) or the presence (closed bars) of 3.5 μm GF1 before PDBu stimulation.
FIGURE 5.
FIGURE 5.
Mechanism of PKD catalytic activation in response to bombesin in Swiss 3T3 cells; differential regulation of Ser744 and Ser748 phosphorylation. A, inhibition of in vitro PKD catalytic activity by K252a. Swiss 3T3 PKD.GFP cells were stimulated with bombesin for 10 min and then lysed in ice-cold buffer. PKD was immunoprecipitated from lysates with an anti-PKD C-20 antibody bound to protein A-agarose and assayed for syntide-2 phosphorylation activity in the presence of various concentrations of K252a (as indicated) or 3.5 μm GF1. B, Swiss 3T3-PKD.GFP were incubated in the absence (–) or in the presence 3.5 μm GF1 or 1 μm K252a as indicated for 1 h before stimulation with 10 nm bombesin for either 10 or 240 min. The cultures were then lysed with 2× SDS-PAGE sample buffer. C, Swiss 3T3-PKD.GFP or Swiss 3T3-PKDK618N.GFP were incubated in the absence (–) or in the presence (+) of 2.5 μm Gö 6983 for 1 h before stimulation of the cells with 10 nm bombesin for the indicated times. The cultures were then lysed with 2× SDS-PAGE sample buffer. All samples were analyzed by SDS-PAGE and immunoblotting with the antibodies phospho PKD Ser(P)916, Ser(P)744, Ser(P)748, and PKD-C20 to verify equal loading. The results shown here are representative autoluminograms; similar results were obtained in four independent experiments in panel B and three independent experiments in panel C. D, recombinant purified PKD was incubated with 100 μm ATP in kinase buffer for the times indicated. The reactions were terminated with 2× SDS-PAGE sample buffer. E, PKD eluted from Swiss 3T3 immunocomplexes was incubated with 200 μm ATP in kinase buffer for the times indicated. The reactions were terminated with 2× SDS-PAGE sample buffer. All samples were analyzed by SDS-PAGE and immunoblotting with the following antibodies phospho-PKD Ser(P)744 and Ser(P)748. All other details are as described under “Experimental Procedures.” The results shown here are representative autoluminograms; similar results were obtained in two independent experiments.
FIGURE 6.
FIGURE 6.
PKD expression prolongs ERK signaling in response to bombesin or vasopressin through a PKC-independent but EGFR-dependent pathway. A, confluent and quiescent cultures of Swiss 3T3-PKD.GFP cells were washed and incubated at 37 °C in 2 ml DMEM in the presence (+) or in the absence (–) of 3.5 μm GF109203X (GF1) for 1 h before stimulation of the cells with 10 nm bombesin for the indicated times. The cultures were then lysed with 2× SDS-PAGE sample buffer and analyzed by SDS-PAGE and immunoblotting with phospho-ERK antibody (pERK1/2), phospho-p90rsk antibody (p90RSK), or phospho-focal adhesion kinase (FAK) Ser910. Shown here are representative autoluminograms. Similar results were obtained in four independent experiments. The membrane was further analyzed by Western blotting using ERK2 antibody (ERK2) to verify equal loading. B–D, confluent and quiescent cultures of Swiss 3T3-PKD.GFP cells were washed and incubated at 37 °C in 2 ml of DMEM in the absence (–) or presence (+) of 3.5 μm GF109203X (GF1), 500 nm AG1478, or 500 nm Compound 56 (CP56) as indicated for 1 h before stimulation of the cells with either 10 nm bombesin or 50 nm vasopressin for 10 or 240 min as indicated. The cultures were then lysed with 2× SDS-PAGE sample buffer and analyzed by SDS-PAGE and immunoblotting with phospho-ERK antibody (pERK1/2). Shown here are representative autoluminograms. Similar results were obtained in six independent experiments. The membrane was further analyzed by Western blotting using ERK2 antibody (ERK2) to verify equal loading.
FIGURE 7.
FIGURE 7.
PKD expression potentiates DNA synthesis in response to bombesin or vasopressin through a PKC-independent but EGFR-dependent pathway. A, confluent and quiescent cultures of Swiss 3T3 PKD.GFP cells were washed and incubated at 37 °C in 2 ml of DMEM/Waymouth's medium containing [3H]thymidine and either 10 and 3 nm bombesin (Bom) or 50 nm vasopressin (VP) either in the absence (open bars) or presence of either 3.5 μm GF109203X (closed bars) or Go6978 (hatched bars). After 40 h, DNA synthesis was assessed by measuring the [3H]thymidine incorporated into acid-precipitable material. Results are expressed as a percentage mean ± S.E. (n = 3) of maximum stimulation obtained with 10% fetal bovine serum (105 × 10–3 cpm). B, confluent and quiescent cultures of Swiss 3T3 PKD.GFP cells were washed and incubated at 37 °C in 2 ml of DMEM/Waymouth's medium containing [3H]thymidine and either 10 nm bombesin (Bom) or 50 nm vasopressin (VP). Some of these cultures were incubated in the absence (open bars) or presence (closed bars) of 500 nm AG1478, added at the same time as bombesin or vasopressin (0 h) or 1 h or 3 h after the addition of bombesin or vasopressin (+1 h, +3 h). DNA synthesis was assessed by measuring the [3H]thymidine incorporated into acid-precipitable material. Results are expressed as a percentage mean ± S.E. (n = 3) of maximum stimulation obtained with 10% fetal bovine serum (98 × 10–3 cpm) C, confluent and quiescent cultures of Swiss 3T3-PKD.GFP cells were washed and incubated at 37 °C in 2 ml of DMEM in the absence (–) or presence (+) of 3.5 μm GF1 or 500 nm AG1478 for 1 h before stimulation of the cells with 100 nm PDBu for 10 or 240 min as indicated. The cultures were then lysed with 2× SDS-PAGE sample buffer, then analyzed by SDS-PAGE and immunoblotting with phospho-ERK antibody (pERK1/2) or phospho-p90RSK antibody (p90RSK) as indicated. Shown here are representative autoluminograms. Similar results were obtained in four independent experiments. The membrane was further analyzed by Western blotting using ERK2 antibody (ERK2) to verify equal loading. D, confluent and quiescent cultures of Swiss 3T3 PKD.GFP cells were washed and incubated at 37 °C in 2 ml of DMEM/Waymouth's medium containing [3H]thymidine and 100 nm PDBu either in the absence (open bars) or presence of 3.5 μm GF109203X (closed bars) or Go6978 (hatched bars). After 40 h DNA synthesis was assessed by measuring the [3H]thymidine incorporated into acid-precipitable material. Results are expressed as a percentage mean ± S.E. (n = 3) of maximum stimulation obtained with 10% fetal bovine serum (105 × 10–3 cpm).

References

    1. Rozengurt, E., Rey, O., and Waldron, R. T. (2005) J. Biol. Chem. 280 13205–13208 - PubMed
    1. Iglesias, T., and Rozengurt, E. (1998) J. Biol. Chem. 273 410–416 - PubMed
    1. Iglesias, T., and Rozengurt, E. (1999) FEBS Lett. 454 53–56 - PubMed
    1. Waldron, R. T., and Rozengurt, E. (2003) J. Biol. Chem. 278 154–163 - PubMed
    1. Zugaza, J. L., Sinnett-Smith, J., Van Lint, J., and Rozengurt, E. (1996) EMBO J. 15 6220–6230 - PMC - PubMed

Publication types

MeSH terms