. 2009 Jun;77(6):2251-61.
doi: 10.1128/IAI.00068-09. Epub 2009 Mar 16.

Yersinia pestis can reside in autophagosomes and avoid xenophagy in murine macrophages by preventing vacuole acidification

Affiliations

Yersinia pestis can reside in autophagosomes and avoid xenophagy in murine macrophages by preventing vacuole acidification

Céline Pujol et al. Infect Immun. 2009 Jun.

Abstract

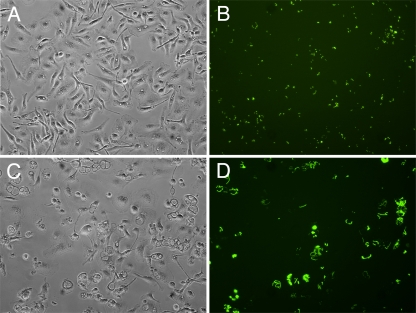
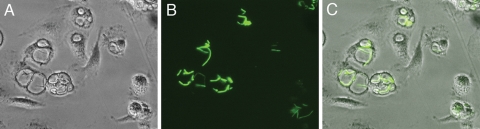
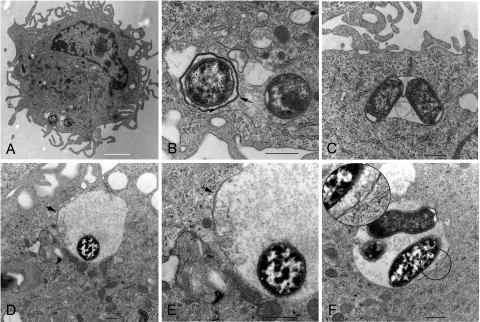
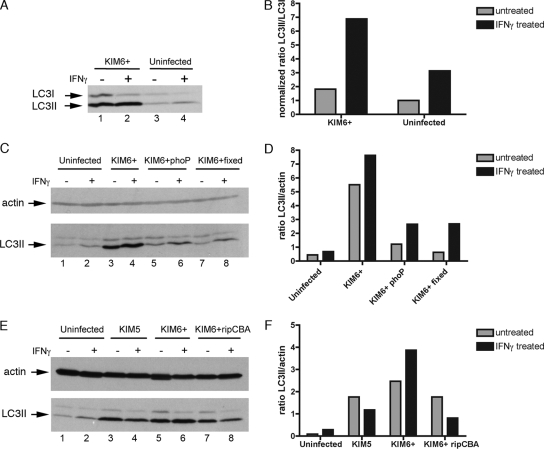
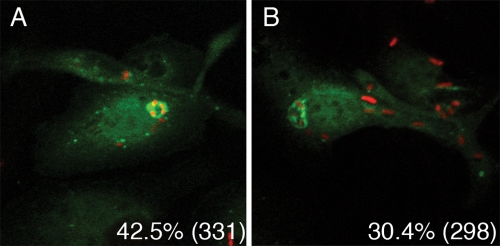
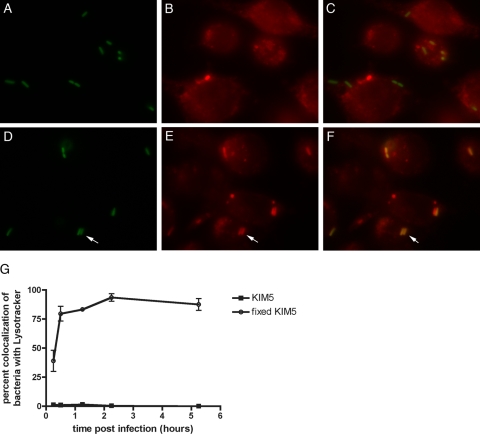
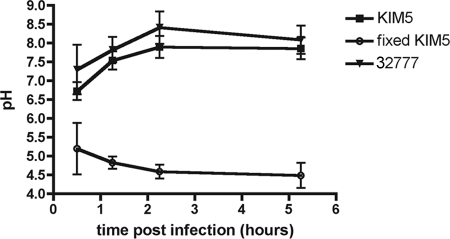
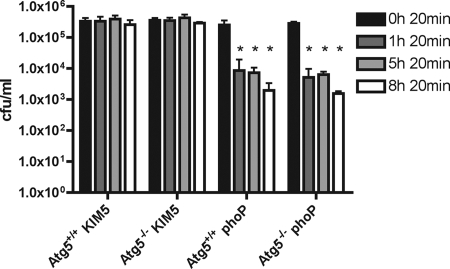
Yersinia pestis survives and replicates in phagosomes of murine macrophages. Previous studies demonstrated that Y. pestis-containing vacuoles (YCVs) acquire markers of late endosomes or lysosomes in naïve macrophages and that this bacterium can survive in macrophages activated with the cytokine gamma interferon. An autophagic process known as xenophagy, which destroys pathogens in acidic autophagolysosomes, can occur in naïve macrophages and is upregulated in activated macrophages. Studies were undertaken here to investigate the mechanism of Y. pestis survival in phagosomes of naïve and activated macrophages and to determine if the pathogen avoids or co-opts autophagy. Colocalization of the YCV with markers of autophagosomes or acidic lysosomes and the pH of the YCV were determined by microscopic imaging of infected macrophages. Some YCVs contained double membranes characteristic of autophagosomes, as determined by electron microscopy. Fluorescence microscopy showed that approximately 40% of YCVs colocalized with green fluorescent protein (GFP)-LC3, a marker of autophagic membranes, and that YCVs failed to acidify below pH 7 in naïve macrophages. Replication of Y. pestis in naïve macrophages caused accumulation of LC3-II, as determined by immunoblotting. While activation of infected macrophages increased LC3-II accumulation, it decreased the percentage of GFP-LC3-positive YCVs (approximately 30%). A viable count assay showed that Y. pestis survived equally well in macrophages proficient for autophagy and macrophages rendered deficient for this process by Cre-mediated deletion of ATG5, revealing that this pathogen does not require autophagy for intracellular replication. We conclude that although YCVs can acquire an autophagic membrane and accumulate LC3-II, the pathogen avoids xenophagy by preventing vacuole acidification.


Figures

FIG. 1.
FIG. 1.
Analysis of Y. pestis replication in activated macrophages by microscopy. BMDMs infected with KIM5+/GFP were activated with IFN-γ and incubated for 6 h (A and B) or 24 h (C and D) before microscopic examination. One hour before examination, IPTG was added to induce de novo expression of GFP in viable intracellular bacteria. (A and C) Representative phase-contrast microscopy images. (B and D) Representative fluorescence microscopy images.
FIG. 2.
FIG. 2.
Examination of Y. pestis-containing spacious phagosomes in activated macrophages by microscopy. (A and B) Enlargements of regions of panels C and D of Fig. 1, respectively. (C) Overlay of panels A and B.
FIG. 3.
FIG. 3.
YCV morphology in activated macrophages as determined by thin-section EM. BMDMs were infected with KIM5+ and then treated with IFN-γ. At 4 h (A to C) or 22 h (D to F) the cells were fixed and processed for thin-section EM. (A) BMDM infected with KIM5+ at 4 h postinfection. (B) Magnification of area containing bacteria in panel A. The arrow indicates a double membrane surrounding a single bacterium. (C) BMDM infected with KIM5+ at 4 h postinfection, showing two bacteria and other vesicles in a single-membrane compartment. (D) BMDM infected with KIM5+ for 22 h. The arrow indicates a region with a double membrane. (E) Magnification of a region in panel D. (F) BMDM infected with KIM5+ for 22 h. A region containing a double membrane is magnified in the inset. (A) Bar = 2 μm. (B to F) Bars = 500 nm.
FIG. 4.
FIG. 4.
Immunoblot analysis of LC3 levels in BMDMs exposed to IFN-γ and infected with Y. pestis. BMDMs were not infected or were infected with KIM6+ in the presence or absence of IFN-γ. At 24 h postinfection cell lysates were prepared and subjected to SDS-polyacrylamide gel electrophoresis, followed by immunoblotting with anti-LC3 antibody (A, C, and E) and anti-actin antibody (C and E). For panels C and E, macrophages were infected with the KIM6+ phoP mutant, with KIM6+ fixed with paraformaldehyde, with KIM5, or with the KIM6+ ripCBA mutant. Densitometry was used to quantify band signals for LC3-I and LC3-II (A) or for LC3-II and actin (C and E), and calculated ratios are shown in panels B, D, and F, respectively. For panel B the ratio of LC3-II to LC3-I in uninfected and untreated cells was defined as 1, and other ratios were normalized to this value.
FIG. 5.
FIG. 5.
Analysis of GFP-LC3 colocalization with YCVs. BMDMs were transduced with retrovirus producing GFP-LC3. Twenty-four hours posttransduction, the macrophages were infected with KIM6+/mCherry. De novo expression of mCherry was induced in viable intracellular bacteria by addition of IPTG. After 8 h of infection with Y. pestis in the absence (A) or presence (B) of IFN-γ, cells were fixed and processed for examination by fluorescence microscopy. Images were obtained by using confocal fluorescence microscopy. The panels show overlays of GFP-LC3 (green) and mCherry (red) signals from representative images. The percentages of colocalization of signals as determined by epifluorescence microscopy are shown for each condition, and the numbers of phagosomes scored are indicated in parentheses.
FIG. 6.
FIG. 6.
Measurement of YCV acidification using Lysotracker and fluorescence microscopy. J774A.1 macrophages on coverslips were infected with live KIM5/GFP (A to C) or fixed KIM5/GFP (D to F) in the presence of Lysotracker Red DND-99. At 1.25 h postinfection the samples were fixed, and representative images were obtained by using a fluorescence microscope equipped with a digital camera. The images show the GFP signal (A and D), the Lysotracker signal (B and E), or an overlay of the two signals (C and F). (G) Percent colocalization of GFP and Lysotracker signals at the indicated time points, as quantified using three independent experiments. The symbols indicate averages, and the error bars indicate standard deviations.
FIG. 7.
FIG. 7.
Measurement of YCV pH using live cell ratiometric imaging. Live KIM5 cells, fixed KIM5 cells, or live 32777 cells labeled with FITC were used to infect J774A.1 macrophages. At the indicated time points live cell imaging was performed using a confocal microscope. Images were obtained by using excitation wavelengths of 488 nm and 458 nm. A calibration curve was generated using the ionophores monensin and nigericin and media buffered at pHs between pH 4 and 7. Comparison of the 488 nm/458 nm ratio to the pH calibration curve was used to estimate the pH of YCVs. The symbols indicate the averages of three experiments (for 32777) or of five experiments (for KIM5 and fixed KIM5), and the error bars indicate standard deviations.
FIG. 8.
FIG. 8.
CFU assay of Y. pestis survival in ATG5flox/flox-Lyz-Cre BMDMs or control ATG5flox/flox BMDMs. BMDMs prepared from ATG5flox/flox-Lyz-Cre mice (Atg5−/−) or control ATG5flox/flox mice (Atg5+/+) were infected with KIM5 or the KIM5 phoP mutant at an MOI of 10. After 20 min of infection the macrophages were washed to remove nonadherent bacteria and then incubated in medium containing gentamicin to kill extracellular bacteria. At the indicated time points washed macrophages were lysed in detergent, and serial dilutions were plated to enumerate CFU. The data are values from three independent experiments, and the error bars indicate standard deviations. An asterisk indicates a significant difference (P < 0.01) compared to the data for the 20-min time point for the same group, as determined by one-way analysis of variance with Dunnett's posttest.

References

    1. Achtman, M., G. Morelli, P. Zhu, T. Wirth, I. Diehl, B. Kusecek, A. J. Vogler, D. M. Wagner, C. J. Allender, W. R. Easterday, V. Chenal-Francisque, P. Worsham, N. R. Thomson, J. Parkhill, L. E. Lindler, E. Carniel, and P. Keim. 2004. Microevolution and history of the plague bacillus, Yersinia pestis. Proc. Natl. Acad. Sci. USA 10117837-17842. - PMC - PubMed
    1. Alexeyev, M. F. 1995. Three kanamycin resistance gene cassettes with different polylinkers. BioTechniques 1852, 54, 56. - PubMed
    1. Amano, A., I. Nakagawa, and T. Yoshimori. 2006. Autophagy in innate immunity against intracellular bacteria. J. Biochem. 140161-166. - PubMed
    1. Birmingham, C. L., V. Canadien, N. A. Kaniuk, B. E. Steinberg, D. E. Higgins, and J. H. Brumell. 2008. Listeriolysin O allows Listeria monocytogenes replication in macrophage vacuoles. Nature 451350-354. - PubMed
    1. Cavanaugh, D. C., and R. Randall. 1959. The role of multiplication of Pasteurella pestis in mononuclear phagocytes in the pathogenesis of fleaborne plague. J. Immunol. 85348-363. - PubMed

Publication types

LinkOut - more resources