

Hippocampal atrophy rates in Alzheimer disease: added value over whole brain volume measures
- PMID: 19289740
- PMCID: PMC2821835
- DOI: 10.1212/01.wnl.0000344568.09360.31
Hippocampal atrophy rates in Alzheimer disease: added value over whole brain volume measures
Abstract
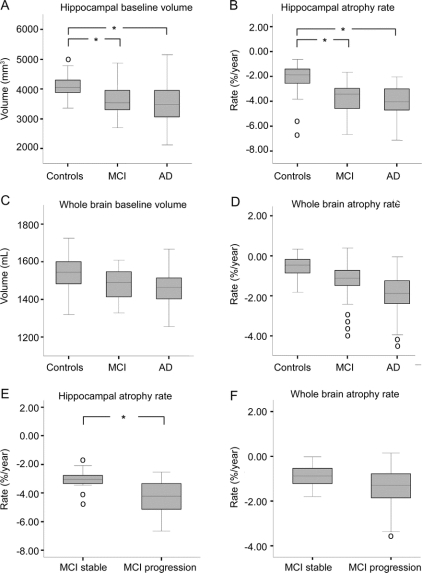
Objective: To investigate the added value of hippocampal atrophy rates over whole brain volume measurements on MRI in patients with Alzheimer disease (AD), patients with mild cognitive impairment (MCI), and controls.
Methods: We included 64 patients with AD (67 +/- 9 years; F/M 38/26), 44 patients with MCI (71 +/- 6 years; 21/23), and 34 controls (67 +/- 9 years; 16/18). Two MR scans were performed (scan interval: 1.8 +/- 0.7 years; 1.0 T), using a coronal three-dimensional T1-weighted gradient echo sequence. At follow-up, 3 controls and 23 patients with MCI had progressed to AD. Hippocampi were manually delineated at baseline. Hippocampal atrophy rates were calculated using regional, nonlinear fluid registration. Whole brain baseline volumes and atrophy rates were determined using automated segmentation and registration tools.
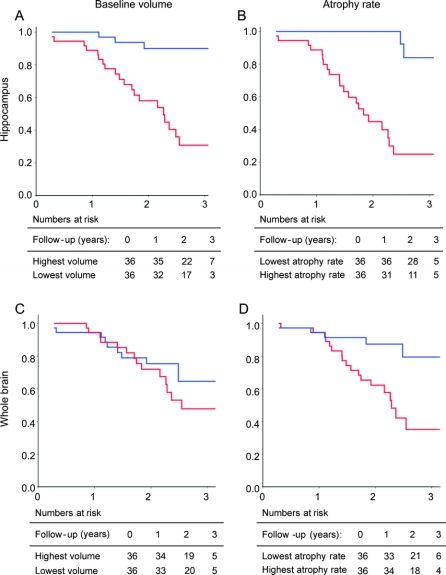
Results: All MRI measures differed between groups (p < 0.005). For the distinction of MCI from controls, larger effect sizes of hippocampal measures were found compared to whole brain measures. Between MCI and AD, only whole brain atrophy rate differed significantly. Cox proportional hazards models (variables dichotomized by median) showed that within all patients without dementia, hippocampal baseline volume (hazard ratio [HR]: 5.7 [95% confidence interval: 1.5-22.2]), hippocampal atrophy rate (5.2 [1.9-14.3]), and whole brain atrophy rate (2.8 [1.1-7.2]) independently predicted progression to AD; the combination of low hippocampal volume and high atrophy rate yielded a HR of 61.1 (6.1-606.8). Within patients with MCI, only hippocampal baseline volume and atrophy rate predicted progression.
Conclusion: Hippocampal measures, especially hippocampal atrophy rate, best discriminate mild cognitive impairment (MCI) from controls. Whole brain atrophy rate discriminates Alzheimer disease (AD) from MCI. Regional measures of hippocampal atrophy are the strongest predictors of progression to AD.
Figures
References
-
- Braak H, Braak E. Neuropathological staging of Alzheimer-related changes. Acta Neuropathol 1991;82:239–259. - PubMed
-
- Fotenos AF, Snyder AZ, Girton LE, Morris JC, Buckner RL. Normative estimates of cross-sectional and longitudinal brain volume decline in aging and AD. Neurology 2005;64:1032–1039. - PubMed
-
- Karas GB, Scheltens P, Rombouts SA, et al. Global and local gray matter loss in mild cognitive impairment and Alzheimer’s disease. Neuroimage 2004;23:708–716. - PubMed
MeSH terms
Grants and funding
LinkOut - more resources
Full Text Sources
Medical