. 2009 Mar 23;184(6):895-908.
doi: 10.1083/jcb.200901042. Epub 2009 Mar 16.

GSK3beta phosphorylation modulates CLASP-microtubule association and lamella microtubule attachment

Affiliations

GSK3beta phosphorylation modulates CLASP-microtubule association and lamella microtubule attachment

Praveen Kumar et al. J Cell Biol. .

Abstract

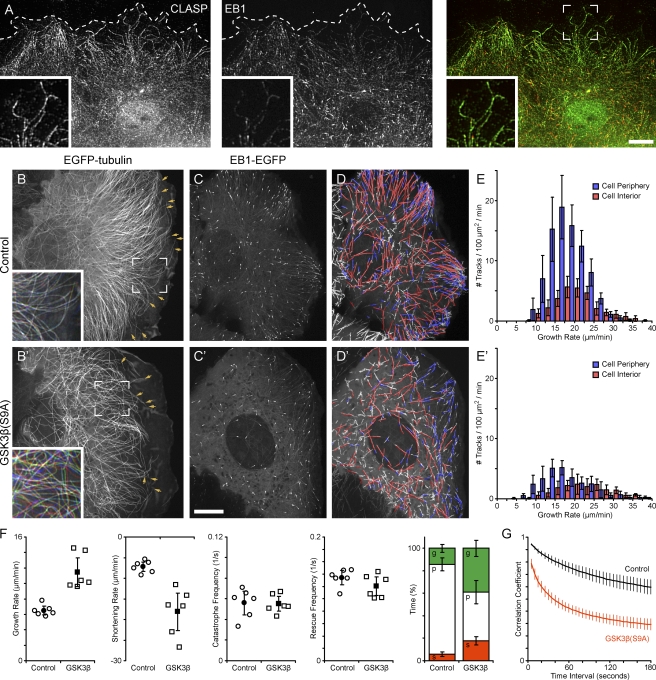
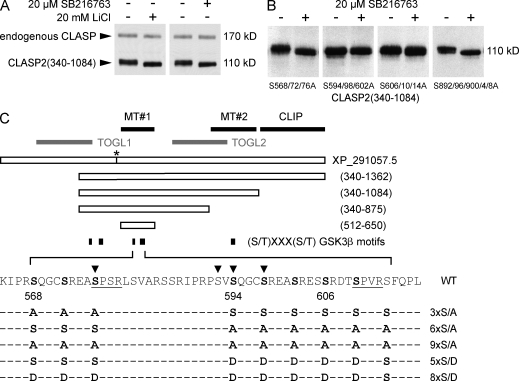
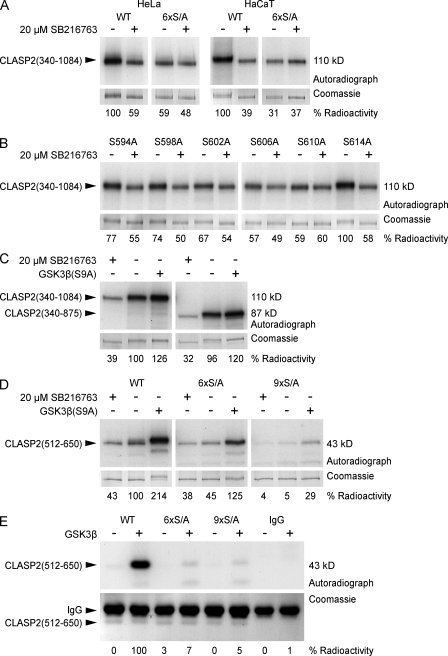
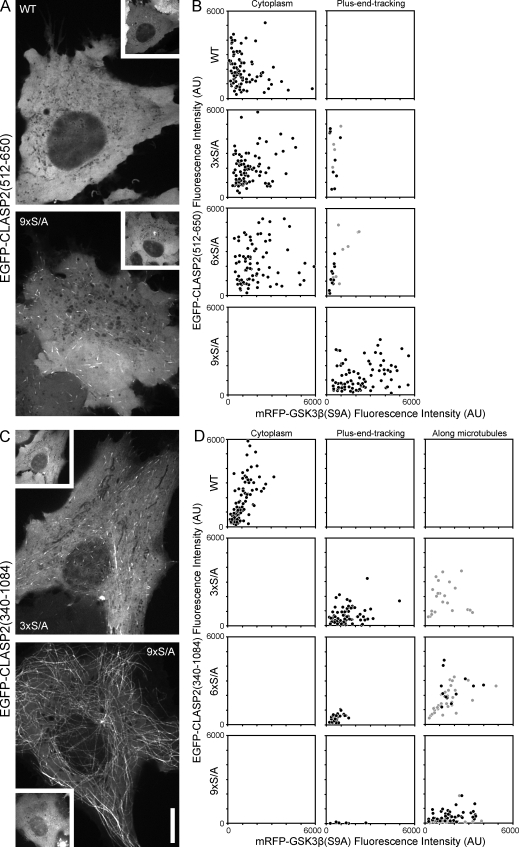
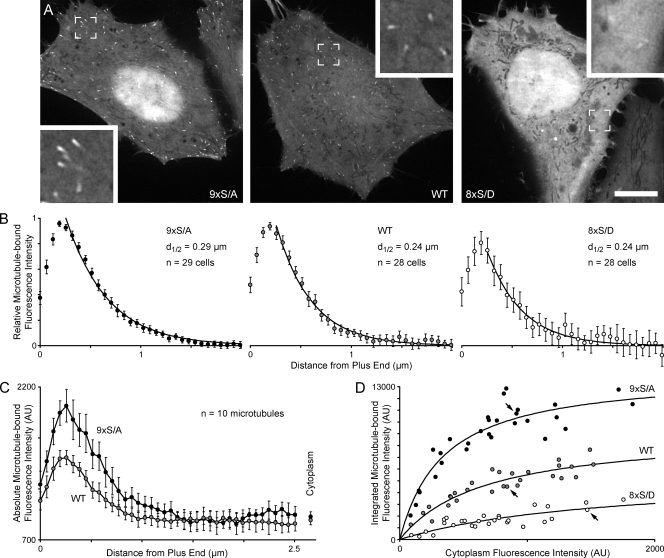
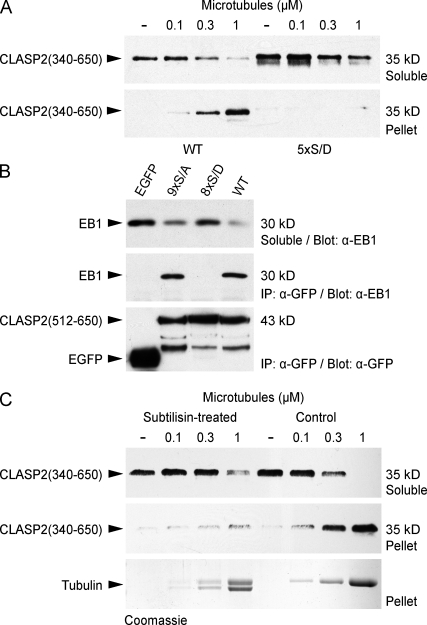
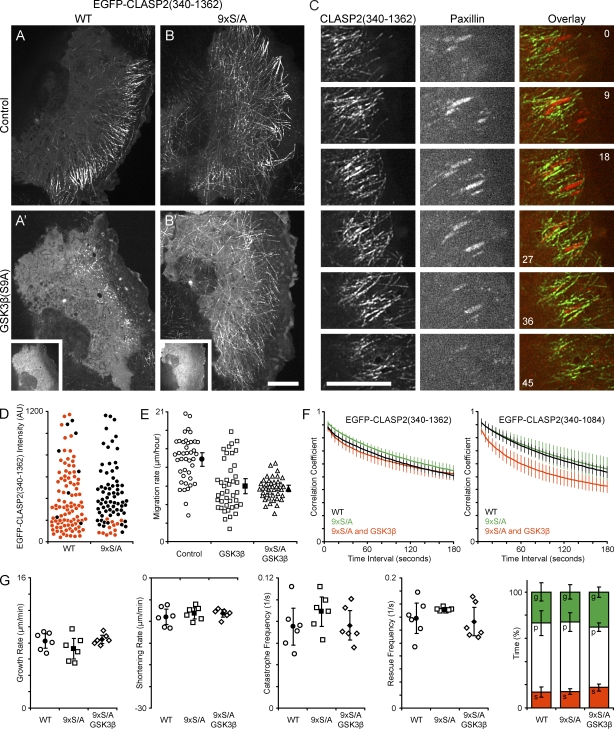
Polarity of the microtubule (MT) cytoskeleton is essential for many cell functions. Cytoplasmic linker-associated proteins (CLASPs) are MT-associated proteins thought to organize intracellular MTs and display a unique spatiotemporal regulation. In migrating epithelial cells, CLASPs track MT plus ends in the cell body but bind along MTs in the lamella. In this study, we demonstrate that glycogen synthase kinase 3beta (GSK3beta) directly phosphorylates CLASPs at multiple sites in the domain required for MT plus end tracking. Although complete phosphorylation disrupts both plus end tracking and association along lamella MTs, we show that partial phosphorylation of the identified GSK3beta motifs determines whether CLASPs track plus ends or associate along MTs. In addition, we find that expression of constitutively active GSK3beta destabilizes lamella MTs by disrupting lateral MT interactions with the cell cortex. GSK3beta-induced lamella MT destabilization was partially rescued by expression of CLASP2 with mutated phosphorylation sites. This indicates that CLASP-mediated stabilization of peripheral MTs, which likely occurs in the vicinity of focal adhesions, may be regulated by local GSK3beta inactivation.


Figures

Figure 1.
Figure 1.
Ectopic GSK3β activation increases lamella MT dynamics. (A) Immunofluorescence of endogenous CLASP and EB1 in migrating HaCaT keratinocytes. Dashed lines indicate the cell's leading edge. Insets show a peripheral cell region at a higher magnification. (B) Migrating HaCaT keratinocyte expressing EGFP-tubulin. (B and B′) Arrows indicate MTs that are part of the quantification in F, and insets show an overlay of images from the original time-lapse sequence acquired at 0, 30, and 60 s. The colors indicate lateral movement of MTs during this time period. (C) HaCaT cell expressing EB1-EGFP. (D) Computer-generated tracks of EB1 comets over 38 s (99 frames) overlaid on a maximum intensity projection of the entire sequence. Red indicates growth rates above and blue below the median. Only tracks with a lifetime of >4 s (10 frames) are shown. (E) Histogram of growth rates in the cell periphery (blue) and cell interior (red). (B–E) Control HaCaT cells. (B′–E′) HaCaT cells expressing constitutively active mRFP-GSK3β(S9A). (F) Analysis of lamella MT polymerization dynamics in control and GSK3β(S9A)-expressing cells. Open symbols indicate parameters calculated from individual cells, and closed symbols indicate means. The bar graph summarizes time MTs spent growing (g), pausing (p), or shortening (s). (G) Plot of the correlation coefficient between image regions in the lamella of EGFP-tubulin–expressing cells as a function of the time interval between images. Error bars indicate 95% confidence intervals; n = 6 cells. Bars, 10 µm.
Figure 2.
Figure 2.
Identification of physiological CLASP2 GSK3β phosphorylation sites. (A) Immunoblot of HeLa cell lysates probed with a polyclonal CLASP antibody (Hannak and Heald, 2006). Treatment with GSK3β inhibitors (20 µM SB216763 or 10 mM LiCl) results in dephosphorylation (downshift) of endogenous CLASP and transfected EGFP-CLASP2(340–1,084) that contains all potential GSK3β sites. (B) Mutation of GSK3β motifs within the MT plus end tracking domain identifies the motif between S594 and S614 as responsible for the GSK3β inhibitor–induced gel shift. (C) Diagram of constructs and phosphorylation site mutants used in this study. Bolded letters indicate serine residues identified to be phosphorylated by GSK3β. Predicted Cdk consensus motifs are underlined. Arrowheads indicate phosphorylated residues identified by mass spectrometry phosphoproteomics (Trinidad et al., 2006; Matsuoka et al., 2007; Dephoure et al., 2008; Imami et al., 2008). The numbering of amino acid positions corresponds to the old National Center for Biotechnology Information reference sequence XP_291057.5. This record has been replaced by NP_055912, which has a longer N terminus. However, we have kept the numbering for consistency with our previous paper (Wittmann and Waterman-Storer, 2005). The asterisk indicates an eight–amino acid difference between the CLASP2 clone used in this study and XP_291057.5. Black bars indicate functionally defined domains: MT#1, MT plus end tracking and EB1-binding domain; MT#2, region required for binding along lamella MTs; CLIP, C-terminal domain required for association with CLIP-170 and LL5β. Gray bars indicate putative TOG-like domains (Slep and Vale, 2007).
Figure 3.
Figure 3.
Analysis of CLASP2 phosphorylation. (A–D) Metabolic labeling of tissue culture cells with [32P]-labeled phosphate. EGFP-tagged CLASP2 constructs were immunoprecipitated and analyzed by SDS-PAGE. Top panels show autoradiograph, and bottom panels show the corresponding Coomassie-stained gel as loading control. Quantification of radioactivity incorporation by densitometry is shown below the gel images. (A) In both HeLa and HaCaT cells, GSK3β inhibition with 20 µM SB216763 decreases CLASP2(340–1,084) phosphorylation. Mutation of the GSK3β motif between S594 to S614 (6×S/A) eliminates GSK3β-dependent phosphorylation. (B) Mutation of individual serine residues between S594 and S614 shows that S614 is not part of the motif and reveals hierarchical phosphorylation by GSK3β. (C) The domain required for CLASP2 association along lamella MTs (875–1,084) is not required for efficient phosphorylation by GSK3β. (D) Combined mutation of the GSK3β motifs between S568 to S576 and S594 to S614 (9×S/A) is required to completely abolish phosphorylation of the MT plus end tracking domain CLASP2(512–650) by constitutively active GSK3β(S9A). (E) In vitro phosphorylation of immunoprecipitated EGFP-CLASP2(512–650) by purified GSK3β in the presence of γ-[32P]ATP.
Figure 4.
Figure 4.
Phosphorylation site mutations rescue CLASP2–MT binding in cells expressing constitutively active GSK3β(S9A). (A) Representative examples of HeLa cells expressing WT or mutated EGFP-CLASP2(512–650) containing only the plus end tracking domain MT#1 in combination with mRFP-GSK3β(S9A) (insets). WT EGFP-CLASP2(512–650) is completely cytoplasmic in cells expressing constitutively active GSK3β(S9A), whereas the 9×S/A construct robustly tracks MT plus ends. (B) Scatter plots of cells with different expression levels of EGFP-CLASP2(512–650) phosphorylation site mutants and of constitutively active mRFP-GSK3β(S9A) categorized by whether the CLASP2 construct was detectable on MT plus ends or not. Each symbol represents the mean cytoplasmic EGFP and mRFP fluorescence intensities of an individual HeLa cell. Gray symbols indicate cells in which plus end tracking was barely detectable. (C) Representative examples of HeLa cells expressing mutated EGFP-CLASP2(340–1,084) containing both MT#1 as well as MT#2 required for CLASP association along lamella MTs in combination with mRFP-GSK3β(S9A) (insets). Mutation of the first GSK3β motif, 3×S/A, completely rescues plus end tracking but has little effect on binding along MTs. Mutation of all GSK3β sites, 9×S/A, is necessary to rescue binding along MTs, and this construct shows almost no preference for plus ends. (D) Scatter plots of cells with different expression levels of EGFP-CLASP2(340–1,084) phosphorylation site mutants and of constitutively active mRFP-GSK3β(S9A) categorized by whether the CLASP2 construct was only in the cytoplasm, on MT plus ends, or bound along MTs. Each symbol represents the mean cytoplasmic EGFP and mRFP fluorescence intensities of an individual HeLa cell. Gray symbols indicate cells with only weak binding along MTs. All images were taken at identical illumination and exposure settings. The axes on all graphs are scaled identically. AU, arbitrary unit. Bar, 10 µm.
Figure 5.
Figure 5.
GSK3β phosphorylation modulates MT affinity of the CLASP2 plus end tracking domain. (A) Representative examples of HeLa cells expressing WT or mutated EGFP-CLASP2(512–650) as indicated. Images were taken at identical illumination and exposure settings. Insets show MT plus ends at a higher magnification. (B) Normalized mean EGFP-CLASP2(512–650) fluorescence profile along MT plus ends showing that mutation of GSK3β phosphorylation sites does not affect the decay of CLASP2(512–650) binding with increasing distance from plus ends. Fluorescence intensities are normalized to the maximum MT-bound fluorescence intensity (1) and the background in the surrounding cytoplasm (0). Three MTs were measured per cell. The number of cells per condition is indicated on the graphs. The measurement error for the 8×S/D construct is large because MT binding of this construct was very weak. d1/2 indicates the distance from the MT plus end at which half of the EGFP-CLASP construct has dissociated from the growing plus end as determined by least-square curve fitting to a single exponential decay function (solid lines). (C) Absolute EGFP-CLASP2(512–650) fluorescence profile along MT plus ends in cells with similar expression levels (the same cells as in A). Although the fluorescence decay constant is similar, the absolute amount of plus end–bound 9×S/A is significantly larger than of WT EGFP-CLASP2(512–650). (D) Integrated fluorescence intensity from absolute fluorescence profiles as in C plotted against the mean cytoplasmic fluorescence, indicating quantitative differences in MT binding of the different mutants. This represents the same dataset as in B, but profiles were not normalized. Each circle represents the mean of three MTs per cell. Arrows indicate the cells shown in A. Solid lines show least-square fits to a hyperbolic binding isotherm. AU, arbitrary unit. Error bars indicate 95% confidence intervals. Bar, 10 µm.
Figure 6.
Figure 6.
Binding of the CLASP2 plus end tracking domain to the tubulin C terminus and EB1 is directly inhibited by GSK3β phosphorylation. (A) Sedimentation assay of 6×His-CLASP2(340–650) at constant concentration (0.5 µM) with an increasing concentration of taxol-stabilized MTs. Comparison of the WT with a mutated protein in which the GSK3β sites between S594 and S610 were replaced with phosphomimetic aspartate residues (5×S/D) shows that the phosphomimetic mutant does not bind MTs. (B) Immunoprecipitation (IP) using GFP antibodies from HeLa cells expressing EGFP-tagged CLASP2–MT plus end tracking domain constructs. Endogenous EB1 only immunoprecipitates with WT EGFP-CLASP2(512–650) and the nonphosphorylatable mutant 9×S/A but not with pseudophosphorylated 8×S/D or EGFP alone. (C) Sedimentation assay using MTs treated with subtilisin, which removes the flexible tubulin C terminus, resulting in a downshift of the α/β-tubulin bands on the Coomassie-stained gel. 6×His-CLASP2(340–650) does not bind to subtilisin-treated MTs.
Figure 7.
Figure 7.
CLASP2–MT interactions mediated by GSK3β inactivation contribute to lamella MT dynamics. (A) Migrating HaCaT keratinocyte expressing EGFP-CLASP2(340–1,362). (B) HaCaT cell expressing 9×S/A EGFP-CLASP2(340–1,362) containing mutated GSK3β phosphorylation sites. (A and B) Control HaCaT cells. (A′ and B′) HaCaT cells additionally expressing constitutively active mRFP-GSK3β(S9A) (insets). (C) Dynamics of EGFP-CLASP2(340–1,362) and mCherry-paxillin in focal adhesions in the leading lamella of a migrating HaCaT cell. Elapsed time is indicated in minutes. (D) Quantification of ectopic EGFP-CLASP2(340–1,362) association along cell body MTs of WT or the nonphosphorylatable 9×S/A construct as a function of cytoplasmic EGFP fluorescence intensity. Red symbols represent cells with plus end tracking only, and black symbols represent cells in which the CLASP construct is clearly detectable along cell body MTs. (E) Quantification of migration rates of control HaCaT cells and cells expressing GSK3β(S9A) alone or in combination with 9×S/A CLASP2(340–1,362). Open symbols represent individual cells, and closed symbols represent means. n = 42 cells. (F) Plot of the correlation coefficient between image regions in the lamella of cells expressing the indicated EGFP-CLASP2(340–1,362) or EGFP-CLASP(340–1,084) constructs as a function of the time interval between images. n = 6 cells. (G) Analysis of lamella MT polymerization dynamics by direct manual tracking of EGFP-CLASP2(340–1,362)–decorated MTs. Open symbols represent parameters calculated from individual cells, and closed symbols represent means of measurements from all six cells analyzed. The bar graph summarizes time MTs spent growing (g), pausing (p), or shortening (s). AU, arbitrary unit. Error bars indicate 95% confidence intervals. Bars, 10 µm.

References

    1. Akhmanova A., Steinmetz M.O. 2008. Tracking the ends: a dynamic protein network controls the fate of microtubule tips.Nat. Rev. Mol. Cell Biol. 9:309–322 - PubMed
    1. Akhmanova A., Hoogenraad C.C., Drabek K., Stepanova T., Dortland B., Verkerk T., Vermeulen W., Burgering B.M., De Zeeuw C.I., Grosveld F., Galjart N. 2001. Clasps are CLIP-115 and -170 associating proteins involved in the regional regulation of microtubule dynamics in motile fibroblasts.Cell. 104:923–935 - PubMed
    1. Bieling P., Kandels-Lewis S., Telley I.A., van Dijk J., Janke C., Surrey T. 2008. CLIP-170 tracks growing microtubule ends by dynamically recognizing composite EB1/tubulin-binding sites.J. Cell Biol. 183:1223–1233 - PMC - PubMed
    1. Boukamp P., Petrussevska R.T., Breitkreutz D., Hornung J., Markham A., Fusenig N.E. 1988. Normal keratinization in a spontaneously immortalized aneuploid human keratinocyte cell line.J. Cell Biol. 106:761–771 - PMC - PubMed
    1. Cassimeris L., Spittle C. 2001. Regulation of microtubule-associated proteins.Int. Rev. Cytol. 210:163–226 - PubMed

Publication types

MeSH terms

Substances