. 2009 Mar 31;106(13):5436-41.
doi: 10.1073/pnas.0812860106. Epub 2009 Mar 16.

Natural images dominate in binocular rivalry

Affiliations

Natural images dominate in binocular rivalry

Daniel H Baker et al. Proc Natl Acad Sci U S A. .

Abstract

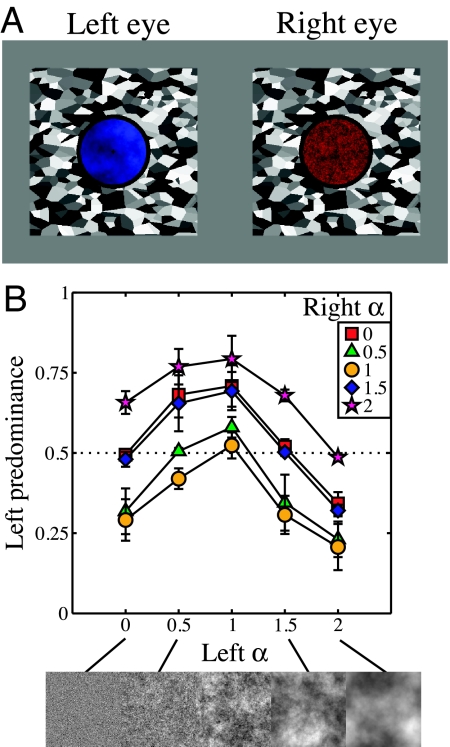
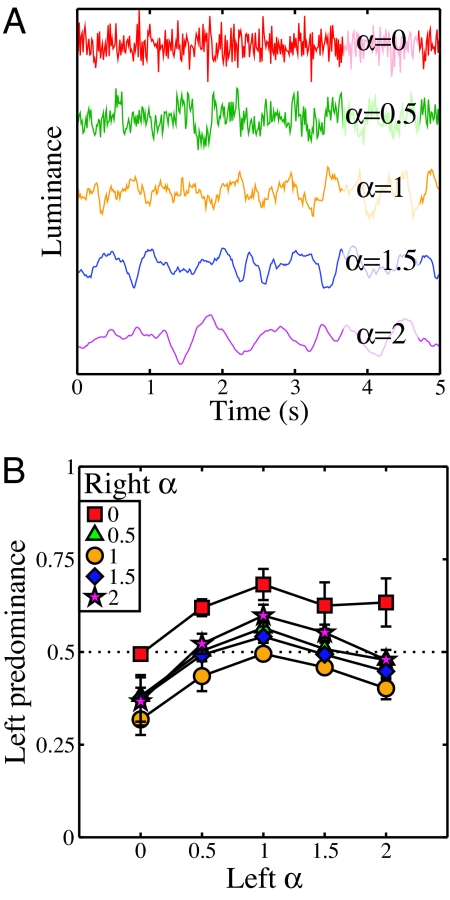
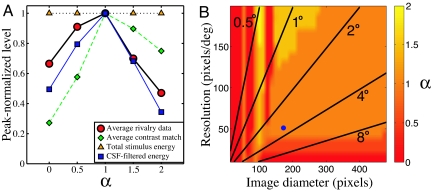
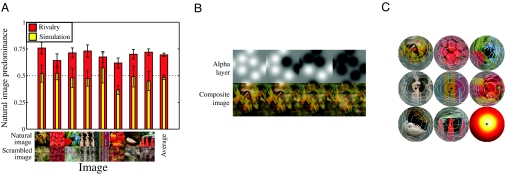
Ecological approaches to perception have demonstrated that information encoding by the visual system is informed by the natural environment, both in terms of simple image attributes like luminance and contrast, and more complex relationships corresponding to Gestalt principles of perceptual organization. Here, we ask if this optimization biases perception of visual inputs that are perceptually bistable. Using the binocular rivalry paradigm, we designed stimuli that varied in either their spatiotemporal amplitude spectra or their phase spectra. We found that noise stimuli with "natural" amplitude spectra (i.e., amplitude content proportional to 1/f, where f is spatial or temporal frequency) dominate over those with any other systematic spectral slope, along both spatial and temporal dimensions. This could not be explained by perceived contrast measurements, and occurred even though all stimuli had equal energy. Calculating the effective contrast following attenuation by a model contrast sensitivity function suggested that the strong contrast dependency of rivalry provides the mechanism by which binocular vision is optimized for viewing natural images. We also compared rivalry between natural and phase-scrambled images and found a strong preference for natural phase spectra that could not be accounted for by observer biases in a control task. We propose that this phase specificity relates to contour information, and arises either from the activity of V1 complex cells, or from later visual areas, consistent with recent neuroimaging and single-cell work. Our findings demonstrate that human vision integrates information across space, time, and phase to select the input most likely to hold behavioral relevance.


Conflict of interest statement

The authors declare no conflict of interest.

Figures

Fig. 1.
Fig. 1.
Example stimuli and results of experiment I. (A) Example static noise stimuli shown to left and right eyes, tinted blue and red to aid identification. The surrounding binocular ring and Voronoi texture aided fusion. (B) Results averaged across 4 observers and expressed as left predominance—the proportion of time the left image was reported as seen—as a function of α for the left eye. The terms “left” and “right” are used for convenience only, as in the experiment these were counterbalanced. Note that data points where both images had the same exponent sit near the horizontal dotted midline, indicating that they were equally dominant.
Fig. 2.
Fig. 2.
Temporal luminance profiles and results of experiment II. (A) Example luminance profiles of a single pixel at different temporal α values. The functions are displaced vertically for clarity. (B) Results for experiment II, displayed in the same format as those in Fig. 1B. Here, α gives the exponent determining the temporal amplitude spectrum.
Fig. 3.
Fig. 3.
Analysis of scaling metrics for fractal noise stimuli. (A) Peak-normalized functions for (i) rivalry data from Fig. 1B averaged across condition (red circles), (ii) contrast matching data, averaged over 3 observers (green diamonds), (iii) total stimulus energy (orange triangles), and (iv) effective contrast of noise stimuli after attenuation by a model CSF (blue squares). (B) Intensity map showing the strongest α value averaged over 100 simulations of the effective contrast model (note that the peak varied across successive simulations in only a small number of cases). The blue circle corresponds to the stimulus dimensions from experiment I, and radial lines indicate stimulus size in degrees of visual angle.
Fig. 4.
Fig. 4.
Results and example stimuli for experiment III, in which natural images rivaled with their phase-scrambled counterparts. (A) Data plotted as the proportion of time the natural image was reported as dominant during rivalry (red) and simulation (yellow) conditions, for 8 images. The average across all images is given by the bar (Right). Data are averaged across 6 observers, with error bars showing ± 1SE. In the rivalry conditions, the natural images were seen for the majority of each trial. (B) Example stimuli from the replay condition—the alpha layer (Upper) determines transparency of the natural image. As the Gaussians comprising the alpha layer were varied over time, they produced a range of composite images, as shown (Lower). (C) Correlation maps show how the state of each pixel (natural or scrambled image) is predictive of observer responses (average of 6 observers). The contrast of each pixel is scaled in proportion to its correlation coefficient (r), and contours enclose the 10th-, 30th-, 50th-, 70th-, and 90th-percentile r values. The lower right circle is an intensity map of r averaged across all 8 images.

References

    1. Geisler WS. Visual perception and the statistical properties of natural scenes. Annu Rev Psychol. 2008;59:167–192. - PubMed
    1. Mante V, Frazor RA, Bonin V, Geisler WS, Carandini M. Independence of luminance and contrast in natural scenes and in the early visual system. Nat Neurosci. 2005;8:1690–1697. - PubMed
    1. Brunswick E, Kamiya J. Ecological cue validity of ‘proximity’ an other Gestalt factors. Am J Psych. 1953;66:20–32. - PubMed
    1. Elder JH, Goldberg RM. Ecological statistics of Gestalt laws for the perceptual organisation of contours. J Vis. 2002;2:324–353. - PubMed
    1. Maloney LT. Evaluation of linear models of surface spectral reflectance with small numbers of parameters. J Opt Soc Am A. 1986;3:1673–1683. - PubMed

Publication types

LinkOut - more resources