. 2009 Mar 31;106(13):5282-7.
doi: 10.1073/pnas.0810909106. Epub 2009 Mar 16.

Induction and regulatory function of miR-9 in human monocytes and neutrophils exposed to proinflammatory signals

Affiliations

Induction and regulatory function of miR-9 in human monocytes and neutrophils exposed to proinflammatory signals

Flavia Bazzoni et al. Proc Natl Acad Sci U S A. .

Abstract

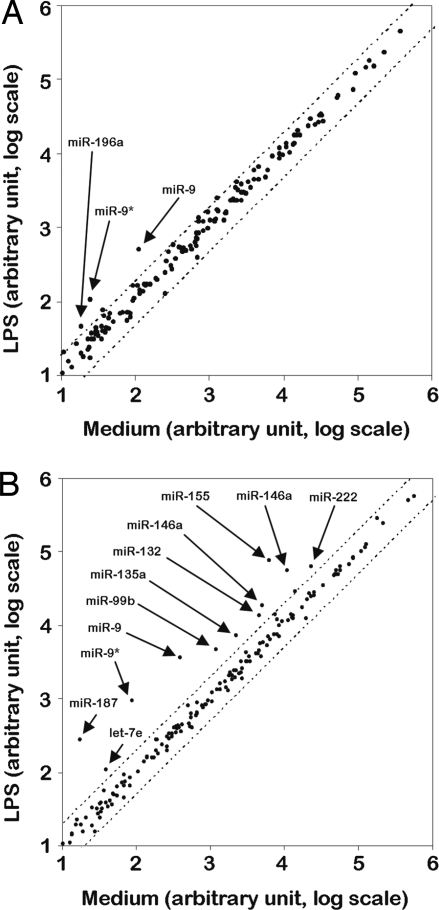
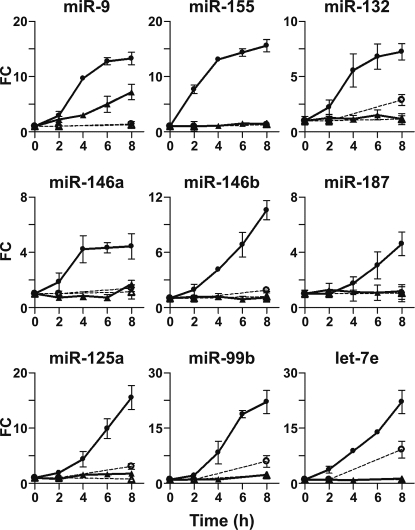
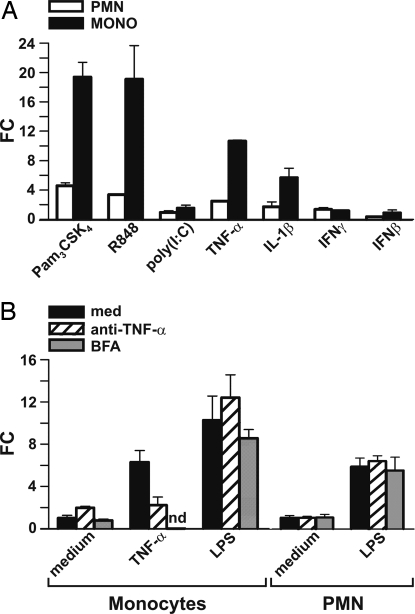
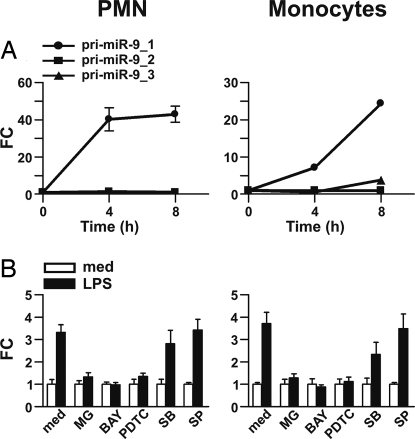
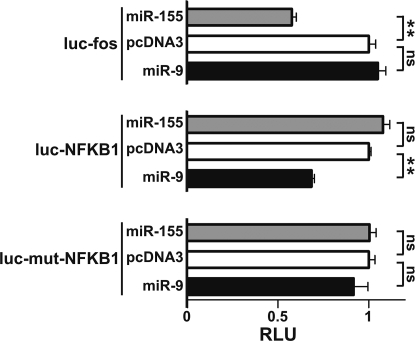
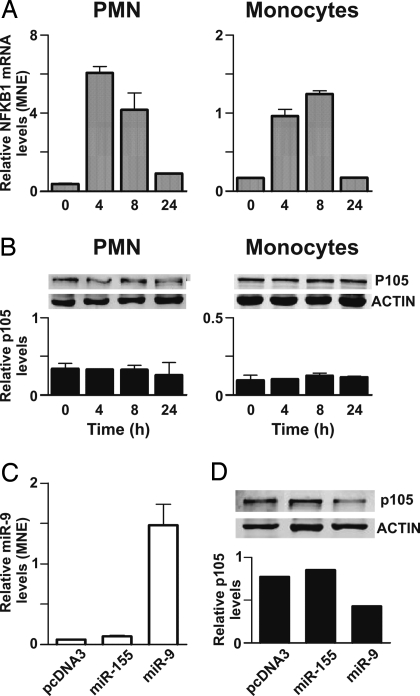
Inflammation involves a coordinated, sequential, and self limiting sequence of events controlled by positive and negative regulatory mechanisms. Recent studies have shown that microRNAs (miRNAs), an evolutionarily conserved class of endogenous 22-nucleotide noncoding RNAs, contribute to the regulation of inflammation by repressing gene expression at the posttranscriptional level. In this study, we characterize the profile of miRNAs induced by LPS in human polymorphonuclear neutrophils (PMN) and monocytes. In particular, we identify miR-9 as the only miRNA (among 365 analyzed) up-regulated in both cell types after TLR4 activation. miR-9 is also induced by TLR2 and TLR7/8 agonists and by the proinflammatory cytokines TNF-alpha and IL-1beta, but not by IFNgamma. Among the 3 different genes encoding miR-9 precursors in humans, we show that LPS selectively induces the transcription of miR-9-1 located in the CROC4 locus, in a MyD88- and NF-kappaB-dependent manner. In PMN and monocytes, LPS regulates NFKB1 at both the transcriptional and posttranscriptional levels, and a conserved miR-9 seed sustained a miR-9-dependent inhibition of the NFKB1 transcript. Overall, these data suggest that TLR4-activated NF-kappaB rapidly increases the expression of miR-9 that operates a feedback control of the NF-kappaB-dependent responses by fine tuning the expression of a key member of the NF-kappaB family.


Conflict of interest statement

The authors declare no conflict of interest.

Figures

Fig. 1.
Fig. 1.
miRNAs induced by LPS in PMN and monocytes. PMN (A) and autologous monocytes (B) were cultured for 8 h in medium alone or in the presence of 100 ng/ml LPS. The miRNA fraction was purified and changes in miRNA expression levels were determined using a micro fluidic card as described in Materials and Methods. Results are expressed as arbitrary units on a log scale using RNU44 as reference control. The mean values of 2 individual experiments performed are shown. Dotted lines represent the 2 and 0.5 boundary values for fold induction.
Fig. 2.
Fig. 2.
Kinetics of LPS-induced miRNAs in PMN and monocytes. PMN and monocytes were cultured for the indicated times in medium alone (- -▵- - PMN, - -○- - monocytes) or in the presence of 100 ng/ml LPS (—▴— PMN, —●— monocytes). miRNA fraction was purified and miR-9, miR-155, miR-132, miR-146a, miR-146b, miR-187, miR-125a, miR-99b, and let-7e expression was determined by RT-qPCR and normalized to the let-7a levels, as described in Materials and Methods. The results are expressed as fold change and are representative of 3 individual experiments.
Fig. 3.
Fig. 3.
miR-9 is induced by MyD88-activating TLR agonists and proinflammatory cytokines. (A) PMN and monocytes were cultured for 8 h with 100 ng/ml LPS, 100 ng/ml Pam3CSK4, 10 μM R848 or 50 μg/ml poly(I:C), TNF-α, 20 ng/ml IL-1β, 1000 U/ml IFNγ, or 1000 U/ml IFNβ. miRNA fraction was extracted and analyzed for miR-9 expression by RT-qPCR. (B) monocytes and PMN were pretreated for 30 min with medium (black bars), 10 μg/ml anti-TNF-α MoAbs (hatched bars), or 5 μg/ml brefeldin A (gray bars) before stimulation with TNF-α or LPS. miRNA fraction was extracted after 8 h and analyzed for miR-9 expression by RT-qPCR. miRNA expression is depicted as fold change units after let-7a normalization. Data show one experiment representative of 3. nd: not determined.
Fig. 4.
Fig. 4.
LPS up-regulates pri-miR-9–1 in a NF-κB-dependent manner. (A) PMN and monocytes were cultured in the presence or absence of LPS for the indicated time; total RNA was extracted and pri-miR-9–1 (—●—), pri-miR-9–2 (—▴—), and pri-miR-9–3 (—■—) were analyzed by RT-qPCR and normalized to the 18S RNA as described in Materials and Methods. Results show that only pri-miR-9–1, but not pri-miR-9–2 or pri-miR-9–3, was induced by LPS. (B) PMN and monocytes were pretreated for 30 min with medium, 10 μM MG-132, 10 μM BAY-117082, 300 μM PDTC, 20 μM SP-600125, or 10 μM SB-203580 and subsequently cultured for 8 h with or without LPS. miR-9 expression levels were determined by RT-qPCR and expressed as fold change after let-7a normalization. Data show 1 experiment representative of at least 2 for each panel.
Fig. 5.
Fig. 5.
The NFKB1 gene is a molecular target of miR-9. The indicated luciferase constructs (luc vectors) were cotransfected with expression vectors encoding miR-155 (gray columns), miR-9 (black columns), or the pcDNA3 empty vector (white columns). Results are expressed as mean (± SD, n = 3) of the ratio between renilla luciferase and firefly control luciferase activities (RLU), adjusted to 1. **: P < 0.01; ns: P > 0.05.
Fig. 6.
Fig. 6.
Analysis of the endogenous miR-9 target: NFKB1 mRNA and protein expression. (A) PMN and monocytes were cultured in the presence of LPS for the indicated times. Total RNA was purified and used to assay NFKB1 mRNA expression by RT-qPCR, as described in Materials and Methods. Relative NFKB1 gene expression is depicted as MNE units after GAPDH normalization. Data reported are representative of 3 independent experiments. (B) Whole-cell extracts (20 μg) were usually loaded on gels and immunoblots were performed by simultaneously using Abs specific for NFKB1 and Abs specific for actin, followed by incubation with Alexa Fluor-680 goat anti-rabbit Abs. One experiment representative of 3 is shown. The relative NFKB1/p105 levels (± SD, n = 3), quantified as described in SI Materials and Methods, are reported below each panel. (C) 6 × 10⁶ monocytes were transfected with 5 μg of pcDNA3 empty vector, miR-155-encoding vector, or miR-9-encoding vector as described in Material and Methods. 48 hours posttransfection total RNA was purified and analyzed for miR-9 expression by RT-qPCR. Relative miR-9 expression is represented as MNE units after let-7a normalization. (D) Fifteen micrograms of whole cell extracts, purified from transfected monocytes cultured in the same conditions as in (C), were usually loaded on gels and NFKB1/p105 protein was detected as described above. The relative NFKB1/p105 levels, normalized for the total actin, are reported below the Western blot. (C and D) One experiment representative of 2.

References

    1. Akira S, Uematsu S, Takeuchi O. Pathogen recognition and innate immunity. Cell. 2006;124:783–801. - PubMed
    1. Akira S, Takeda K. Toll-like receptor signalling. Nat Rev Immunol. 2004;4:499–511. - PubMed
    1. O'Neill LA. How Toll-like receptors signal: What we know and what we don't know. Curr Opin Immunol. 2006;18:3–9. - PubMed
    1. Liew FY, Xu D, Brint EK, O'Neill LA. Negative regulation of toll-like receptor-mediated immune responses. Nat Rev Immunol. 2005;5:446–458. - PubMed
    1. Mantovani A, Locati M, Polentarutti N, Vecchi A, Garlanda C. Extracellular and intracellular decoys in the tuning of inflammatory cytokines and Toll-like receptors: The new entry TIR8/SIGIRR. J Leukoc Biol. 2004;75:738–742. - PubMed

Publication types

LinkOut - more resources