. 2009 Feb;13(1):43-61.
doi: 10.1089/omi.2009.0011.

Risk assessment and communication tools for genotype associations with multifactorial phenotypes: the concept of "edge effect" and cultivating an ethical bridge between omics innovations and society

Affiliations

Risk assessment and communication tools for genotype associations with multifactorial phenotypes: the concept of "edge effect" and cultivating an ethical bridge between omics innovations and society

Vural Ozdemir et al. OMICS. 2009 Feb.

Abstract

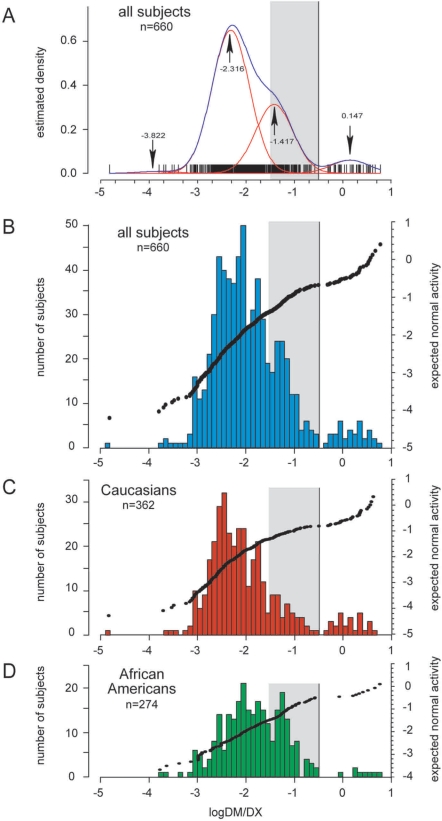
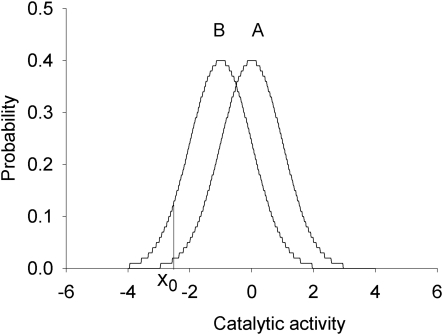
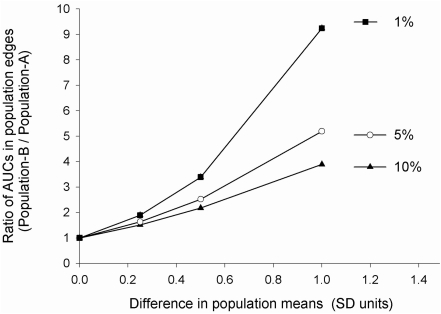
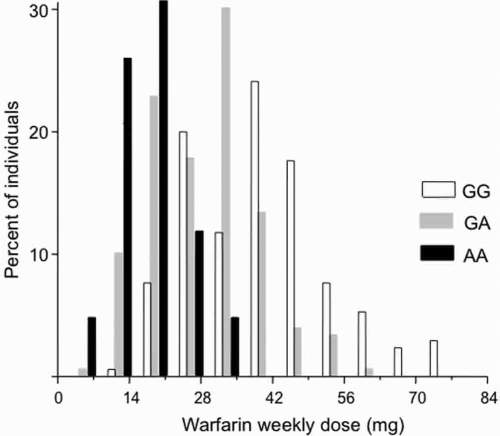
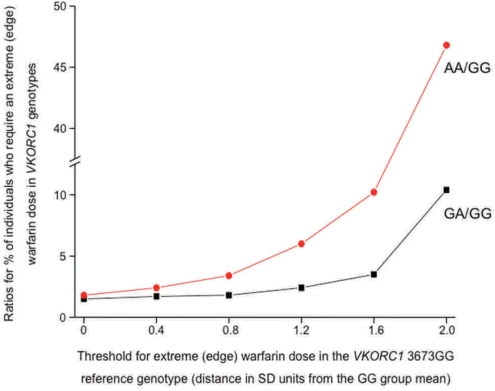
Applications of omics technologies in the postgenomics era swiftly expanded from rare monogenic disorders to multifactorial common complex diseases, pharmacogenomics, and personalized medicine. Already, there are signposts indicative of further omics technology investment in nutritional sciences (nutrigenomics), environmental health/ecology (ecogenomics), and agriculture (agrigenomics). Genotype-phenotype association studies are a centerpiece of translational research in omics science. Yet scientific and ethical standards and ways to assess and communicate risk information obtained from association studies have been neglected to date. This is a significant gap because association studies decisively influence which genetic loci become genetic tests in the clinic or products in the genetic test marketplace. A growing challenge concerns the interpretation of large overlap typically observed in distribution of quantitative traits in a genetic association study with a polygenic/multifactorial phenotype. To remedy the shortage of risk assessment and communication tools for association studies, this paper presents the concept of edge effect. That is, the shift in population edges of a multifactorial quantitative phenotype is a more sensitive measure (than population averages) to gauge the population level impact and by extension, policy significance of an omics marker. Empirical application of the edge effect concept is illustrated using an original analysis of warfarin pharmacogenomics and the VKORC1 genetic variation in a Brazilian population sample. These edge effect analyses are examined in relation to regulatory guidance development for association studies. We explain that omics science transcends the conventional laboratory bench space and includes a highly heterogeneous cast of stakeholders in society who have a plurality of interests that are often in conflict. Hence, communication of risk information in diagnostic medicine also demands attention to processes involved in production of knowledge and human values embedded in scientific practice, for example, why, how, by whom, and to what ends association studies are conducted, and standards are developed (or not). To ensure sustainability of omics innovations and forecast their trajectory, we need interventions to bridge the gap between omics laboratory and society. Appreciation of scholarship in history of omics science is one remedy to responsibly learn from the past to ensure a sustainable future in omics fields, both emerging (nutrigenomics, ecogenomics), and those that are more established (pharmacogenomics). Another measure to build public trust and sustainability of omics fields could be legislative initiatives to create a multidisciplinary oversight body, at arm's length from conflict of interests, to carry out independent, impartial, and transparent innovation analyses and prospective technology assessment.


Figures

FIG. 1.
FIG. 1.
Example of a genotype–phenotype association for a monogenic phenotype. Histograms and cluster analysis present the CYP2D6 activity (phenotype), as measured with dextromethorphan as a probe drug. CYP2D6 activity is expressed as the log of the urinary metabolic ratio of dextromethorphan/dextrorphan log(DM/DX). The red lines in A indicate the four population clusters identified by mclust, the blue line represents the summary line. Mean log(DM/DX) are as indicated for each cluster (arrows). Population histograms are shown for all subjects (B), Caucasians (C) and African Americans (D), respectively. Subjects with discordant genotypes were excluded. The mean log(DM/DX) was −1.912 for all subjects, −1.989 for Caucasians and −1.800 for African-Americans. The gray box highlights the activity range for intermediate metabolizers (−1.52288 ≤ log(DM/DX) < −0.52288 or 0.03 ≤ DM/DX < 0.3). Reprinted by permission from Macmillan Publishers Ltd: [Gaedigk et al., Clin Pharmacol Ther ; 83, 234–242].
FIG. 2.
FIG. 2.
Example of a genotype–phenotype association for a multifactorial phenotype. As a phenotype, standardized normal distributions of catalytic activity of a hypothetical metabolic pathway (subject to multifactorial regulation) are presented (Population A: fast metabolism; Population B: slow metabolism). Xo reflects the threshold activity below which drug or food toxicity is observed. Note that an overlapping phenotypic distribution is a mainstay occurrence in association of a multifactorial phenotype with an omics marker. Reprinted by permission from Bentham Science Publishers: [Ozdemir et al., Curr Pharmacogenomics Person Med ; 3, 53-71].
FIG. 3.
FIG. 3.
Ratio of AUCs at two population edges (B/A) as a function of differences in population means when the toxicity threshold is positioned at the 10th, 5th, or the 1st percentile in the reference population A. Note the upward concavity and the nonlinear increase in the ratio of edge AUCs (population B/population A) (ordinate) with linear increments in the difference between population means (abscissa).
FIG. 4.
FIG. 4.
Frequency histograms of the stable warfarin weekly dose required to achieve an international normalized ratio of prothrombin time (INR) within the optimal target range (2–3.5) in Brazilian patients with cardiovascular disease. The VKORC1 3673G>A polymorphism (rs9923231) was used to stratify the study sample into three genotypic groups. The histogram presents the variability in warfarin dose in the three VKORC1 genotypes: GG (N = 170), GA (N = 180), and AA (N = 40). Data are expressed as percent of the individuals with different warfarin dose requirements in each genotypic group. Note the marked overlap in distribution of warfarin dose among the three VKORC1 genotypes.
FIG. 5.
FIG. 5.
The ratio of edge AUCs for the warfarin phenotype (dose required to reach an optimal INR in Brazilian cardiovascular patients) in VKORC1 3673GA versus GG and, (2) AA versus GG genotypes. The change in the ratio of edge AUCs (ordinate) in these paired genotypic groups is presented as a function of the threshold (abscissa) defining the edge for the warfarin phenotype (expressed as the distance in SD units from the mean phenotypic value of the VKORC1 3673GG reference genotype: 37.9 mg/week). The thresholds for the edge AUCs were located 0.4 SD to 2.0 SD distance from the GG group mean. For the edge effect analysis in paired contrasts (GA vs. GG; and AA vs. GG), we used the pooled the SD for each genotype pair (11.9 and 12.5, respectively). The nonlinear increase (with upward concavity) in the ratio of edge AUCs indicates that the edge effect is more pronounced with more extreme phenotypic edges. The following exercise exemplifies the edge effect calculations further: For the GA and GG genotypic contrast, the threshold defining an edge AUC that is 0.8 SD distance from the reference VKORC1 3673GG group mean (37.9 mg/week warfarin dose) = 37.9 – (0.8 pooled SD for the GA and GG pair) = 37.9 – (0.8*11.9) = 28.4 mg/week. Accordingly, at this threshold defining the phenotype edge for the GG reference genotype, the edge effect = (percent of individuals within the GA group requiring warfarin doses equal to, or smaller than 28.4 mg/week)/(percent of individuals within the reference GG group requiring warfarin doses equal to, or smaller than 28.4 mg/week). The edge effect calculations are subsequently repeated for threshold values defining different edge AUCs by thresholds located from 0.4 SD to 2.0 SD distance from the reference VKORC1 3673GG group mean (37.9 mg/week).

References

    1. Anderson L. Anderson N.G. High resolution two-dimensional electrophoresis of human plasma proteins. Proc Natl Acad Sci USA. 1977;74:5421–5425. - PMC - PubMed
    1. Anderson N.G. Anderson N.L. Twenty years of two-dimensional electrophoresis: past, present and future. Electrophoresis. 1996;17:443–453. - PubMed
    1. Anderson N.G. Matheson A. Anderson N.L. Back to the future: the human protein index (HPI) and the agenda for post-proteomic biology. Proteomics. 2001;1:3–12. - PubMed
    1. Aubert E. Biografilm Associates. W. Long Branch; N.J., USA: 1989. Drawing the line [video recording]: a portrait of Keith Haring. Kultur [distributor].
    1. Baccini M. Bachmaier E.M. Biggeri A. Boekschoten M.V. Bouwman F.G. Brennan L., et al. The NuGO proof of principle study package: a collaborative research effort of the European Nutrigenomics Organisation. Genes Nutr. 2008;3:147–151. - PMC - PubMed

LinkOut - more resources