. 2009 Mar 16:4:14.
doi: 10.1186/1750-1326-4-14.

The PI3K-Akt-mTOR pathway regulates Abeta oligomer induced neuronal cell cycle events

Affiliations

The PI3K-Akt-mTOR pathway regulates Abeta oligomer induced neuronal cell cycle events

Kiran Bhaskar et al. Mol Neurodegener. .

Abstract

Accumulating evidence suggests that neurons prone to degeneration in Alzheimer's Disease (AD) exhibit evidence of re-entry into an aberrant mitotic cell cycle. Our laboratory recently demonstrated that, in a genomic amyloid precursor protein (APP) mouse model of AD (R1.40), neuronal cell cycle events (CCEs) occur in the absence of beta-amyloid (Abeta) deposition and are still dependent upon the amyloidogenic processing of the amyloid precursor protein (APP). These data suggested that soluble Abeta species might play a direct role in the induction of neuronal CCEs. Here, we show that exposure of non-transgenic primary cortical neurons to Abeta oligomers, but not monomers or fibrils, results in the retraction of neuronal processes, and induction of CCEs in a concentration dependent manner. Retraction of neuronal processes correlated with the induction of CCEs and the Abeta monomer or Abeta fibrils showed only minimal effects. In addition, we provide evidence that induction of neuronal CCEs are autonomous to primary neurons cultured from the R1.40 mice. Finally, our results also demonstrate that Abeta oligomer treated neurons exhibit elevated levels of activated Akt and mTOR (mammalian Target Of Rapamycin) and that PI3K, Akt or mTOR inhibitors blocked Abeta oligomer-induced neuronal CCEs. Taken together, these results demonstrate that Abeta oligomer-based induction of neuronal CCEs involve the PI3K-Akt-mTOR pathway.


Figures
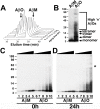
Figure 1
Figure 1
Preparation and characterization of Aβ monomers and Aβ oligomers. A. Preparation of Aβ monomers and Aβ oligomers. Synthetic Aβ peptides were aged for various amounts of time in phosphate buffer followed by SEC fractionation, yielding two major peaks corresponding to Aβ oligomers (AβO) and Aβ monomers (AβM), with Aβ oligomers eluting at 12–15 min and Aβ monomers eluting at 25–30 min. With increased aging, the relative amount of Aβ oligomers increased to a maximum at 24 h. The Z-axis is the relative absorption intensity at 220 nm. B. Western blot analysis of SEC fractionated in vitro preparations of Aβ monomers (AβM) and Aβ oligomers (AβO) with the Aβ specific antibody 6E10, revealed a single, 4.5 kDa monomeric band for AβM and monomer, dimers, trimers, tetramers and large molecular weight oligomers that run between 28–90 kDa (high 'n' AβOs) for AβO. C, D. Western blot analysis of tissue culture media with 0.2 μg/ml (lanes 1 and 6), 0.4 μg/ml (lanes 2 and 7), 0.8 μg/ml (lanes 3 and 8), 2.0 μg/ml (lanes 4 and 9) and 4.0 μg/ml (lanes 5 and 10) of AβM and AβO at the beginning (time = 0 h, C) or end (time = 24 h, D) of the experiment revealed a similar migration pattern of AβM and AβO at both time points. Asterisk indicates the location of abundant proteins in the B27 serum-free supplement.
Figure 2
Figure 2
Purified Aβ oligomers induce BrdU incorporation in primary neurons. Cultured primary cortical neurons (21 DIV) were treated with vehicle (Veh) A-C, 0.4 μg/ml of Aβ monomers (AβM) D-F or 0.4 μg/ml of Aβ oligomers (AβO) G-I or 0.4 μg/ml Aβ fibrils (AβF) J-L in presence of BrdU for 24 h. Cells were fixed and immunostained with antibodies against MAP2 (A, D, G and J) and BrdU (B, E, H and K) demonstrating the induction of BrdU incorporation in MAP2 positive cells (neurons) with Aβ preparations, but not with AβM, AβF or vehicle control (merged images in C, F, I and L). Scale bar, 10 μm. M-O Quantification of the percentage of BrdU positive/MAP2 positive cells in vehicle, AβM, AβO and AβF treatment groups revealed a statistically significant (p = 0.003 for 2.0 μg/ml; p = 0.006 for 4.0 μg/ml; unpaired t test; mean ± SEM; n = 3 independent experiments) increase in the percentage of BrdU/MAP2 positive cells upon exposure to AβO, but not AβM or AβF, compared to vehicle control. P. Western blot analysis of detergent soluble cell lysates from neurons exposed to different concentrations of Aβ with an antibody against the S-phase cell cycle protein, PCNA, and an antibody against the protein loading control, GAPDH. Q. Quantification of the Westernblot for PCNA (relative to GAPDH) revealing a statistically significant (p = 0.008 for 20 μg/ml) increase in the PCNA expression in the 20 μg/ml AβO treatment group. PCNA/GAPDH ratio at 20 μg/ml AβO treatment was assigned as 100%.
Figure 3
Figure 3
Aβ oligomers induce loss of MAP2 positive processes in primary neurons coincident with BrdU incorporation. Cultured primary cortical neurons (21 DIV) were treated with vehicle (Veh, A and D), 4 μg/ml Aβ monomers (AβM, B and E) or 4 μg/ml Aβ oligomers (AβO, C and F) for 24 hours. Following fixation, cells were immunostained with antibodies against MAP2, revealing several long MAP2 positives processes per cell in the vehicle treatment group, a modest reduction in the number of MAP2 positive processes in the AβM treatment group and a dramatic reduction in the number and length of the MAP2 processes in the AβO treatment group. Scale bar, 10 μm. MAP2 positive neurons with shorter processes displaying BrdU incorporation (arrows in F). G-H. Quantification of MAP2 positive dendrites following exposure to Veh or different concentrations of AβM (G) and AβO (H) via automated image processing revealed a statistically significant decrease in MAP2 positive processes (p = 0.006; Veh versus AβO-4 μg/ml; unpaired t test; mean ± SEM; n = 3 independent experiments) when compared to either vehicle or AβM. I-J. Quantification of the total number (I) of MAP2 positive processes as well as the number of processes longer than 5 μm per cell (J) in both BrdU positive and BrdU negative neurons revealed a statistically significant reduction in both number of MAP2 + processes (p = 0.015; mean ± SEM; unpaired t test; n = 3) as well as the number of processes longer than 5 μm (p = 0.05; mean ± SEM; unpaired t test; n = 3) in BrdU positive cells when compared to BrdU negative cells.
Figure 4
Figure 4
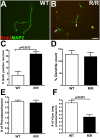
Cell autonomous induction of BrdU and MAP2 process loss in primary neurons from the R1.40 transgenic mouse model of AD. Cultured primary cortical neurons (21 DIV) from non-transgenic (WT, A) and homozygous R1.40 (R/R, B) mouse embryos were incubated with fresh NB media in presence of BrdU for 24 h. Following fixation, cells were immunostained with antibodies against MAP2 (green in A and B) and BrdU (red in A and B) revealing elevated incorporation of BrdU and a decrease in the length of MAP2 positive processes in the R/R cultures. C. Quantification of the percentage of BrdU positive/MAP2 positive cells demonstrated a statistically significant (p = 0.0012; unpaired t test; mean ± SEM; n = 4 independent cultures) increase in R/R cultures when compared to WT cultures. D-F. Quantification of the total dendrite count (total area occupied by all MAP2 positive dendrites per a given field/image) (D) and number of MAP positive processes per cell (E) were not significantly different between WT and R/R cultures, while the number of MAP2 positive processes longer than 5 μm per cell (F) were significantly (p < 0.001; unpaired t test; n = 4 independent cultures) reduced in the R/R cultures when compared to the WT cultures.
Figure 5
Figure 5
Presence of cell-associated and secreted oligomeric Aβ assemblies in primary neurons from the R1.40 transgenic mouse model of AD. A. Western blot analysis of detergent soluble cell extracts of from cultured primary cortical neurons (21 DIV) from non-transgenic (WT) and homozygous R1.40 (R/R) mice revealed the presence of numerous bands migrating between 14 and 38 kDa (arrows) that were immunoreactive with antibody 6E10 (recognizing residues 1–17 of Aβ1–42 peptide) in the R/R samples but not WT samples. Each lane for WT and R/R cultures represents extracts from three independent cultures. hAPP = holo APP; βCTF = β C-terminal fragment. Asterisk denotes the presence of non-specific bands detected with the human-specific 6E10 antibody. B. Primary cortical neurons (21 DIV) from WT and R/R mice were prepared and grown for 24 h in the presence of fresh NB media with (+) or without (-) the B27 serum supplement. Immunoprecipitatation of conditioned media with antibody 6E10, followed by Western blot analysis with the anti-Aβ oligomer specific antibody, NU-2 revealed the presence of multiple NU-2 reactive bands between 30–40 kDa (arrows) that were present in the R/R (lanes 5 and 6), but not WT (lanes 2 and 3) samples. Lanes 1 and 4 shows total input lysates. C-D. Aβ oligomers are secreted by R/R neurons. Cultured primary cortical neurons (21 DIV) from wild-type (WT) and homozygous R1.40 (R/R) embryos were double labeled with MAP2 (green in C and D) or Aβ oligomer specific antibodies NU-1 (red in C) or NU-2 (red in D). Merged images are shown in right panel. NU-1 and NU-2 immunreactivities were specifically observed in R/R, but not WT, neurons. Scale bar 30 μm.
Figure 6
Figure 6
Aβ oligomer treatment increases the levels of pAkt and p-mTOR in primary neurons. A. Cultured primary cortical neurons (21 DIV) plated in 96-well plates were treated with either vehicle (Veh) or increasing concentrations (0.4, 2.0, 3.0, 4.0, 10 and 20 μg/ml) of either Aβ monomer (AβM) or Aβ oligomer (AβO) for 24 h. Following fixation, In-Cell Western analysis, using primary antibodies against tubulin and phosphorylated-Akt (pAktS473) followed by infrared-conjugated secondary antibodies, revealed an apparent increase in pAkt levels in AβO treated cultures. C. Quantification of the pAkt/Tubulin ratio in these cultures revealed a dose-dependent statistically significant increase in AβO treated cultures at AβO concentrations above 2.0 μg/ml (2.0 μg/ml-p = 0.006; 3.0 μg/ml -p = 0.04; 4.0 μg/ml -p = 0.005; 10 μg/ml -p = 0.008; 20.0 μg/ml -p = 0.01; mean ± SD; n = 4; unpaired t test), while exposure to AβM did not reveal any alterations in the pAkt/Tubulin ratio. All comparisons were made against AβM at respective concentrations. B. In-Cell Western analysis with primary antibodies against tubulin and phosphorylated-mTOR (p-mTORS2448) revealed an apparent increase in the levels of p-mTOR in the middle concentration ranges (2.0 – 4.0 μg/ml). D. Quantification of the p-mTOR/tubulin ratios revealed a statistically significant (3.0 μg/ml -p = 0.04; unpaired t test; mean ± SD; n = 4) increase in AβO exposed cultures when compared to AβM exposed cultures at similar concentrations. At elevated concentrations of AβO (> 4.0 μg/ml), there was no significant increase in the p-mTOR/tubulin ratio. 'X' denotes wells with no cells (in panel A and B).
Figure 7
Figure 7
Elevation of pAkt levels in primary neurons treated with Aβ oligomers and in neurons from the R1.40 transgenic mouse model of AD. A. Cultured primary cortical neurons (21 DIV) were treated with vehicle (Veh), 2.0 μg/ml Aβ monomers (AβM) or 2.0 μg/ml Aβ oligomers (AβO) for 24 hours. Western blot analysis of cell extracts with antibodies against pAktS473, total Akt, p4E-BP1S65 and GAPDH revealed a slight increase in the levels of pAkt and p4E-BP1 in AβO treated cultures when compared to vehicle or AβM treated cultures. B-C. Quantification of the ratios of pAkt/total Akt (B) and p4E-BP1/GAPDH (C) revealed statistically significant increases upon exposure to AβO (2.0 μg/ml) when compared to AβM treatment (2.0 μg/ml) or vehicle controls (p < 0.05 for AβO versus vehicle or AβM; unpaired t test; mean ± SEM; n = 3 independent treatments). D. Western blot analysis of detergent soluble cell extracts of from cultured primary cortical neurons (21 DIV) from non-transgenic (WT) and homozygous R1.40 (R/R) mice with antibodies against pAkt (pAktS473), p-mTOR (p-mTORS2448) and GAPDH revealed elevated levels of pAkt (pAktS473) but not p-mTOR in the R/R neurons when compared to WT neurons. E-F Quantification of the ratios of pAkt/GAPDH (E) and p-mTOR/GAPDH (F) revealed statistically significant increases in the levels of pAkt/GAPDH (p = 0.04; unpaired t test; mean ± SEM; n = 3 independent cultures) but not p-mTOR/GAPDH (p = 0.74; unpaired t test; mean ± SEM; n = 3 independent cultures) in cell lysates form the R/R cultures.
Figure 8
Figure 8
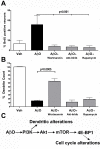
Aβ oligomer induced neuronal CCEs are blocked with inhibitors of the PI3K/Akt/mTOR pathway. A. Cultured primary cortical neurons (21 DIV) were pretreated for 30 min with the PI3K inhibitor wortmannin (100 nM), an Akt inhibitor (100 nM) and the mTOR inhibitor rapamycin (1 μM), followed by exposure to 2.0 μg/ml of Aβ oligomers (AβO) for 24 hours in the presence of BrdU. Following fixation, cells were stained with specific antibodies against BrdU and MAP2. Quantification of the BrdU positive/MAP2 positive cells demonstrated a statistically significant decrease in the percentage of neurons positive for BrdU with all three inhibitors (p < 0.001 for AβO vs AβO+wortmannin, AβO+Akt inhibitor and AβO+rapamycin; one-way ANOVA with Tukey multiple comparison test for pair-wise comparisons; mean ± SEM; n = 4 independent treatments per group). B. Quantification of the loss of MAP2 positive processes upon treatment with AβO in the presence of the PI3K, Akt and mTOR inhibitors was determined via automated image processing and revealed a statistically significant increase in the number of MAP2 positive processes upon pre-treatment with the PI3K inhibitor (p = 0.0005; unpaired t test; mean ± SEM; n = 4 independent treatments), but not the Akt or mTOR inhibitors when compared to AβO treatment alone. C. Diagram outlining a potential pathway underlining the effects of Aβ oligomers on neuronal process retraction and CCEs. Our data suggest that Aβ oligomers activate the PI3K-Akt-mTOR signaling pathway. Activation of PI3K causes phosphorylation of Akt at Ser473, which in turn activates mTOR via phosphorylation at Ser2448. Activation of mTOR results in induction of cell proliferation by down regulation of 4E-BP1 via inhibitory phosphorylation at ser65. Interestingly, our data suggest that the dendritic alterations induced by Aβ oligomers is blocked via inhibition of PI3K via as yet to be identified downstream effectors.

References

    1. Selkoe DJ. Alzheimer's disease: genes, proteins, and therapy. Physiol Rev. 2001;81:741–766. - PubMed
    1. Cummings JL, Cole G. Alzheimer disease. JAMA. 2002;287:2335–2338. doi: 10.1001/jama.287.18.2335. - DOI - PubMed
    1. Yang Y, Mufson EJ, Herrup K. Neuronal cell death is preceded by cell cycle events at all stages of Alzheimer's disease. J Neurosci. 2003;23:2557–2563. - PMC - PubMed
    1. Husseman JW, Nochlin D, Vincent I. Mitotic activation: a convergent mechanism for a cohort of neurodegenerative diseases. Neurobiol Aging. 2000;21:815–828. doi: 10.1016/S0197-4580(00)00221-9. - DOI - PubMed
    1. Copani A, Caraci F, Hoozemans JJ, Calafiore M, Sortino MA, Nicoletti F. The nature of the cell cycle in neurons: focus on a "non-canonical" pathway of DNA replication causally related to death. Biochim Biophys Acta. 2007;1772:409–412. - PubMed

LinkOut - more resources