

Analytical approaches to photobiological hydrogen production in unicellular green algae
- PMID: 19291418
- PMCID: PMC2777220
- DOI: 10.1007/s11120-009-9415-5
Analytical approaches to photobiological hydrogen production in unicellular green algae
Abstract
Several species of unicellular green algae, such as the model green microalga Chlamydomonas reinhardtii, can operate under either aerobic photosynthesis or anaerobic metabolism conditions. A particularly interesting metabolic condition is that of "anaerobic oxygenic photosynthesis", whereby photosynthetically generated oxygen is consumed by the cell's own respiration, causing anaerobiosis in the culture in the light, and induction of the cellular "hydrogen metabolism" process. The latter entails an alternative photosynthetic electron transport pathway, through the oxygen-sensitive FeFe-hydrogenase, leading to the light-dependent generation of molecular hydrogen in the chloroplast. The FeFe-hydrogenase is coupled to the reducing site of photosystem-I via ferredoxin and is employed as an electron-pressure valve, through which electrons are dissipated, thus permitting a sustained electron transport in the thylakoid membrane of photosynthesis. This hydrogen gas generating process in the cells offers testimony to the unique photosynthetic metabolism that can be found in many species of green microalgae. Moreover, it has attracted interest by the biotechnology and bioenergy sectors, as it promises utilization of green microalgae and the process of photosynthesis in renewable energy production. This article provides an overview of the principles of photobiological hydrogen production in microalgae and addresses in detail the process of induction and analysis of the hydrogen metabolism in the cells. Furthermore, methods are discussed by which the interaction of photosynthesis, respiration, cellular metabolism, and H(2) production in Chlamydomonas can be monitored and regulated.
© The Author(s) 2009. This article is published with open access at Springerlink.com
Figures

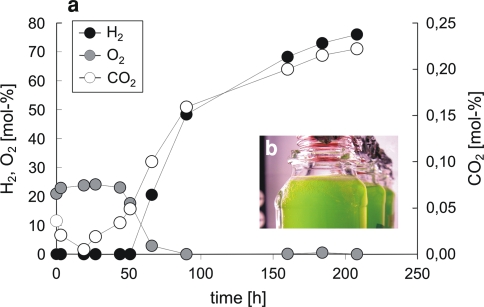
 ), and CO2 (○) as measured by MS in the headspace of an S-depleted C. reinhardtii culture incubated in squared glass bottles sealed with Suba seals upon one-site illumination as illustrated by the photograph in (b) (Hemschemeier 2005)


Similar articles
-
Photosynthetic H2 metabolism in Chlamydomonas reinhardtii (unicellular green algae).Planta. 2007 Oct;226(5):1075-86. doi: 10.1007/s00425-007-0609-9. Epub 2007 Aug 25. Planta. 2007. PMID: 17721788 Review.
-
Water oxidation by photosystem II is the primary source of electrons for sustained H2 photoproduction in nutrient-replete green algae.Proc Natl Acad Sci U S A. 2020 Nov 24;117(47):29629-29636. doi: 10.1073/pnas.2009210117. Epub 2020 Nov 9. Proc Natl Acad Sci U S A. 2020. PMID: 33168746 Free PMC article.
-
Function of the chloroplast hydrogenase in the microalga Chlamydomonas: the role of hydrogenase and state transitions during photosynthetic activation in anaerobiosis.PLoS One. 2013 May 23;8(5):e64161. doi: 10.1371/journal.pone.0064161. Print 2013. PLoS One. 2013. PMID: 23717558 Free PMC article.
-
Biochemical and morphological characterization of sulfur-deprived and H2-producing Chlamydomonas reinhardtii (green alga).Planta. 2002 Feb;214(4):552-61. doi: 10.1007/s004250100660. Planta. 2002. PMID: 11925039
-
Solar-driven hydrogen production in green algae.Adv Appl Microbiol. 2011;75:71-110. doi: 10.1016/B978-0-12-387046-9.00004-9. Adv Appl Microbiol. 2011. PMID: 21807246 Review.
Cited by
-
Metabolic network reconstruction of Chlamydomonas offers insight into light-driven algal metabolism.Mol Syst Biol. 2011 Aug 2;7:518. doi: 10.1038/msb.2011.52. Mol Syst Biol. 2011. PMID: 21811229 Free PMC article.
-
Spontaneous activation of [FeFe]-hydrogenases by an inorganic [2Fe] active site mimic.Nat Chem Biol. 2013 Oct;9(10):607-609. doi: 10.1038/nchembio.1311. Epub 2013 Aug 11. Nat Chem Biol. 2013. PMID: 23934246 Free PMC article.
-
Identification of a chloroplast ribonucleoprotein complex containing trans-splicing factors, intron RNA, and novel components.Mol Cell Proteomics. 2013 Jul;12(7):1912-25. doi: 10.1074/mcp.M112.026583. Epub 2013 Apr 4. Mol Cell Proteomics. 2013. PMID: 23559604 Free PMC article.
-
Increased photosystem II stability promotes H2 production in sulfur-deprived Chlamydomonas reinhardtii.Proc Natl Acad Sci U S A. 2013 Apr 30;110(18):7223-8. doi: 10.1073/pnas.1220645110. Epub 2013 Apr 15. Proc Natl Acad Sci U S A. 2013. PMID: 23589846 Free PMC article.
-
Increased lipid accumulation in the Chlamydomonas reinhardtii sta7-10 starchless isoamylase mutant and increased carbohydrate synthesis in complemented strains.Eukaryot Cell. 2010 Aug;9(8):1251-61. doi: 10.1128/EC.00075-10. Epub 2010 Jun 18. Eukaryot Cell. 2010. PMID: 20562225 Free PMC article.
References
-
- Antal TK, Krendeleva TE, Laurinavichene TV, Makarova VV, Ghirardi ML, Rubin AB, Tsygankov AA, Seibert M. The dependence of algal H2-production on photosystem II and O2 consumption activities in sulphur-deprived Chlamydomonas reinhardtii cells. Biochim Biophys Acta. 2003;1607:153–160. doi: 10.1016/j.bbabio.2003.09.008. - DOI - PubMed
Publication types
MeSH terms
Substances
LinkOut - more resources
Full Text Sources
Other Literature Sources
