

Kinetics of CHO A L mutant expression after treatment with gamma radiation, EMS, and asbestos
- PMID: 19291804
- PMCID: PMC2700661
- DOI: 10.1002/cyto.a.20708
Kinetics of CHO A L mutant expression after treatment with gamma radiation, EMS, and asbestos
Abstract
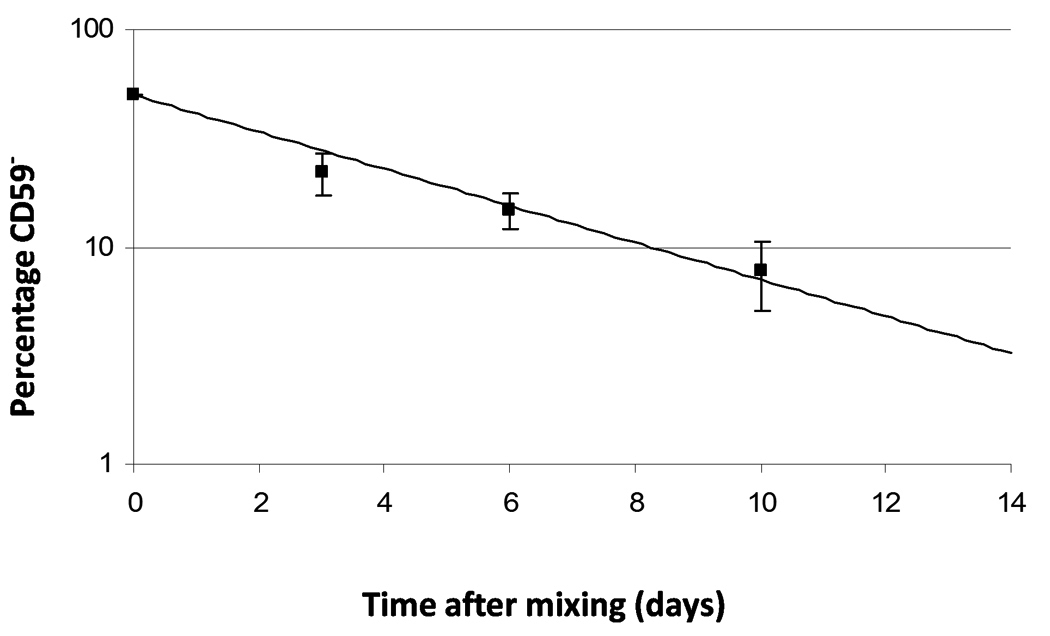
The flow cytometry mutation assay (FCMA) uses hybrid CHO A(L) cells to measure mutations of the cd59 gene located on human chromosome 11 by the absence of fluorochrome-conjugated antibody binding to the CD59 surface antigen. Mutant expression peaks between 6 and 12 days, then decreases to a stable plateau, instead of a constant mutant fraction obtained by clonogenic assays. To evaluate this variable mutant expression time, cells were treated with radiation, EMS or asbestos and cell proliferation and survival were measured at times leading up to peak mutant expression. Potential doubling time (T(pot)) values increased by at least 75% for each agent by 3 h after treatment but returned to control levels after only 3 days. Survival returned to 90% of control within a week, close to the peak expression day for all three agents. The survival of CD59(-) cells sorted on the peak day of expression was roughly half that of CD59(+) cells. Cloned EMS-treated CD59(-) cells had a doubling time of 16.7 vs. 14.1 h for CD59(+) cells. Triple mutants (CD59(-)/CD44(-)/CD90(-)) were preferentially lost from the population over time, while the proportion of CD59(-)/CD90(-) mutants increased. In conclusion, the peak day of mutant expression occurs only when cells recover from the toxic effects of the mutagen. A fraction of cells originally quantified as mutants are lost over time due to lethal deletions and slower growth.
(c) 2009 International Society for Advancement of Cytometry.
Figures


References
-
- Thybaud V, Aardema M, Clements J, Dearfield K, Galloway S, Hayashi M, Jacobson-Kram D, Kirkland D, MacGregor JT, Marzin D, Ohyama W, Schuler M, Suzuki H, Zeiger E. Strategy for genotoxicity testing: hazard identification and risk assessment in relation to in vitro testing. Mutat Res. 2007;627:41–58. - PubMed
-
- Clive D, Johnson KO, Spector JF, Batson AG, Brown MM. Validation and characterization of the L5178Y/TK+/− mouse lymphoma mutagen assay system. Mutat Res. 1979;59:61–108. - PubMed
-
- Moore MM, Honma M, Clements J, Harrington-Brock K, Awogi T, Bolcsfoldi G, Cifone M, Collard D, Fellows M, Flanders K, Gollapudi B, Jenkinson P, Kirby P, Kirchner S, Kraycer J, McEnaney S, Muster W, Myhr B, O'Donovan M, Oliver J, Ouldelhkim MC, Pant K, Preston R, Riach C, San R, Shimada H, Stankowski LF., Jr Mouse lymphoma thymidine kinase gene mutation assay: follow-up International Workshop on Genotoxicity Test Procedures, New Orleans, Louisiana, April 2000. Environ Mol Mutagen. 2002;40:292–299. - PubMed
-
- Wedemeyer N, Greve B, Uthe D, Potter T, Denklau D, Severin E, Hacker-Klom U, Kohnlein W, Gohde W. Frequency of CD59 mutations induced in human-hamster hybrid A(L) cells by low-dose X-irradiation. Mutat Res. 2001;473:73–84. - PubMed
Publication types
MeSH terms
Substances
Grants and funding
LinkOut - more resources
Full Text Sources
Miscellaneous
