Does obesity really make the femur stronger? BMD, geometry, and fracture incidence in the women's health initiative-observational study
- PMID: 19292617
- PMCID: PMC2718796
- DOI: 10.1359/jbmr.090307
Does obesity really make the femur stronger? BMD, geometry, and fracture incidence in the women's health initiative-observational study
Abstract
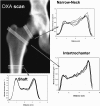
Heavier individuals have higher hip BMD and more robust femur geometry, but it is unclear whether values vary in proportion with body weight in obesity. We studied the variation of hip BMD and geometry across categories of body mass index (BMI) in a subset of postmenopausal non-Hispanic whites (NHWs) from the Women's Health Initiative Observational Cohort (WHI-OS). The implications on fracture incidence were studied among NHWs in the entire WHI-OS. Baseline DXA scans of hip and total body from 4642 NHW women were divided into BMI (kg/m(2)) categories: underweight (<18.5), healthy weight (18.5-24.9), overweight (25-29.9), and mild (30-34.9), moderate (35-39.9), and extreme obesity (>40). Femur BMD and indices of bone axial (cross-sectional area [CSA]) and bending strength (section modulus [SM]) were extracted from DXA scans using the hip structure analysis (HSA) method and compared among BMI categories after adjustment for height, age, hormone use, diabetes, activity level, femur neck-shaft angle, and neck length. The association between BMI and incident fracture was studied in 78,013 NHWs from the entire WHI-OS over 8.5 +/- 2.6 (SD) yr of follow-up. Fracture incidence (cases/1000 person-years) was compared among BMI categories for hip alone, central body (hip, pelvis, spine, ribs, and shoulder girdle), upper extremity (humerus and distal), and lower extremity (femur shaft and distal but not hip). Femur BMD, CSA, and SM were larger in women with higher BMI, but values scaled in proportion to lean and not to fat or total body mass. Women with highest BMI reported more falls in the 12 mo before enrollment, more prevalent fractures, and had lower measures of physical activity and function. Incidence of hip fractures and all central body fractures declined with BMI. Lower extremity fractures distal to the hip trended upward, and upper extremity incidence was independent of BMI. BMD, CSA, and SM vary in proportion to total body lean mass, supporting the view that bones adapt to prevalent muscle loads. Because lean mass is a progressively smaller fraction of total mass in obesity, femur BMD, CSA, and SM decline relative to body weight in higher BMI categories. Traumatic forces increase with body weight, but fracture rates at the hip and central body were less frequent with increasing BMI, possibly because of greater soft tissue padding. There was no evident protective effect in fracture rates at less padded distal extremity sites. Upper extremity fractures showed no variation with BMI, and lower extremity fracture rates were higher only in the overweight (BMI = 25-29.9 kg/m(2)).
Figures


References
-
- Wyatt HR. The prevalence of obesity. Prim Care. 2003;30:267–279. - PubMed
-
- De Laet C, Kanis JA, Oden A, Johanson H, Johnell O, Delmas P, Eisman JA, Kroger H, Fujiwara S, Garnero P, McCloskey EV, Mellstrom D, Melton LJ, III, Meunier PJ, Pols HA, Reeve J, Silman A, Tenenhouse A. Body mass index as a predictor of fracture risk: A meta-analysis. Osteoporos Int. 2005;16:1330–1338. - PubMed
-
- Looker A, Flegal K, Melton LR., III Impact of increased overweight on the projected prevalence of osteoporosis in older women. Osteoporos Int. 2007;18:307–313. - PubMed
-
- Petit M, Beck T, Shults J, Zemel B, Foster B, Leonard M. Proximal femur bone geometry is appropriately adapted to lean mass in overweight children and adolescents. Bone. 2005;36:568–576. - PubMed
Publication types
MeSH terms
Grants and funding
LinkOut - more resources
Full Text Sources
Medical

