

Predicting quantitative traits with regression models for dense molecular markers and pedigree
- PMID: 19293140
- PMCID: PMC2674834
- DOI: 10.1534/genetics.109.101501
Predicting quantitative traits with regression models for dense molecular markers and pedigree
Abstract
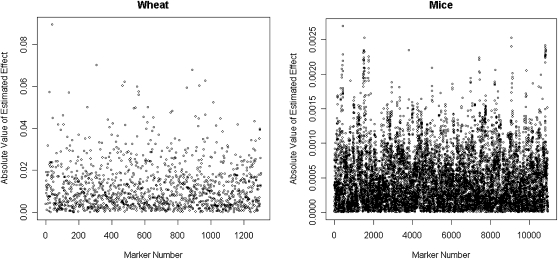
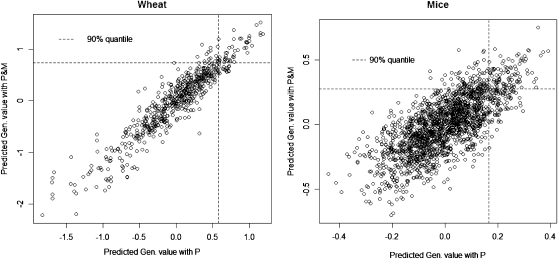
The availability of genomewide dense markers brings opportunities and challenges to breeding programs. An important question concerns the ways in which dense markers and pedigrees, together with phenotypic records, should be used to arrive at predictions of genetic values for complex traits. If a large number of markers are included in a regression model, marker-specific shrinkage of regression coefficients may be needed. For this reason, the Bayesian least absolute shrinkage and selection operator (LASSO) (BL) appears to be an interesting approach for fitting marker effects in a regression model. This article adapts the BL to arrive at a regression model where markers, pedigrees, and covariates other than markers are considered jointly. Connections between BL and other marker-based regression models are discussed, and the sensitivity of BL with respect to the choice of prior distributions assigned to key parameters is evaluated using simulation. The proposed model was fitted to two data sets from wheat and mouse populations, and evaluated using cross-validation methods. Results indicate that inclusion of markers in the regression further improved the predictive ability of models. An R program that implements the proposed model is freely available.
Figures
References
-
- Andrews, D. F., and C. L. Mallows, 1974. Scale mixtures of normal distributions. J. R. Stat. Soc. Ser. B 36 99–102.
-
- Bink, M. C. A. M., P. Uimari, M. J. Sillanpää, L. L. G. Janss and R. C. Jansen, 2002. Multiple QTL mapping in related plant populations via a pedigree-analysis approach. Theor. Appl. Genet. 104 751–762. - PubMed
-
- Bink, M. C. A. M., M. P. Boer, C. J. F. Ter Braak, J. Jansen, R. E. Voorrips et al., 2008. Bayesian analysis of complex traits in pedigreed populations. Euphytica 161 85–96.
-
- Chhikara, R. S, and J. L. Folks, 1989. The Inverse Gaussian Distribution: Theory, Methodology and Applications. Marcel Dekker, NY.
Publication types
MeSH terms
Substances
LinkOut - more resources
Full Text Sources
