. 2009 May 13;37(3):211-24.
doi: 10.1152/physiolgenomics.90362.2008. Epub 2009 Mar 17.

Characterization of a preclinical model of chronic ischemic wound

Affiliations

Characterization of a preclinical model of chronic ischemic wound

Sashwati Roy et al. Physiol Genomics. .

Abstract

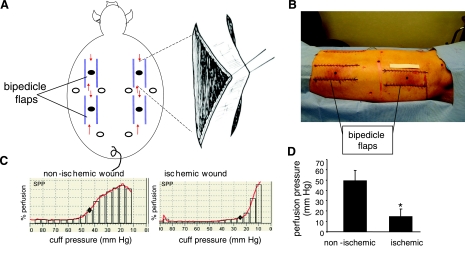
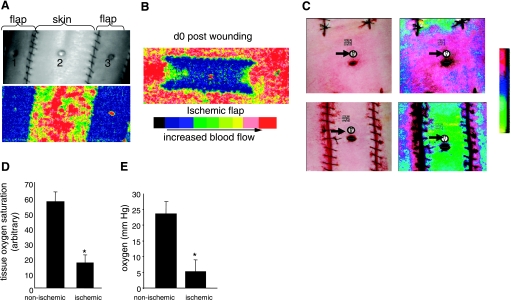
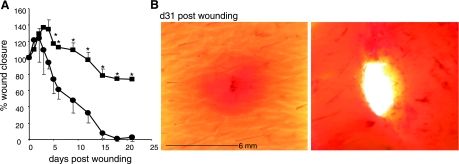
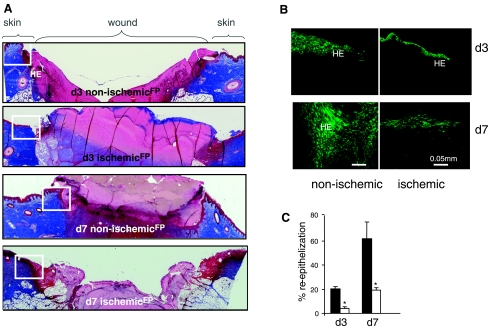
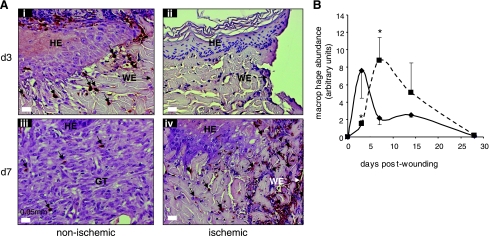
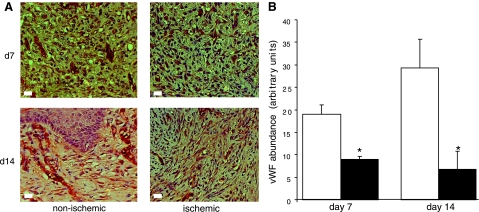
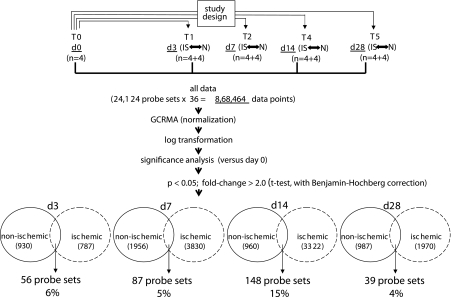
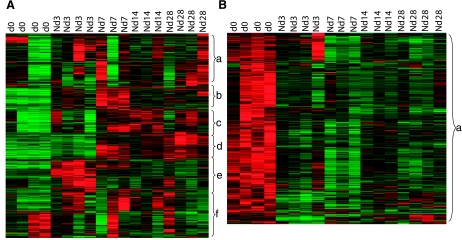
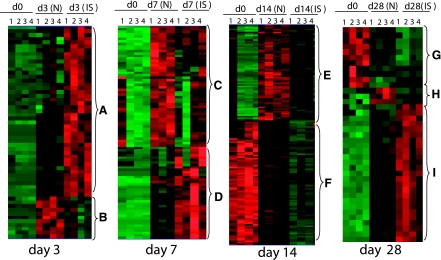
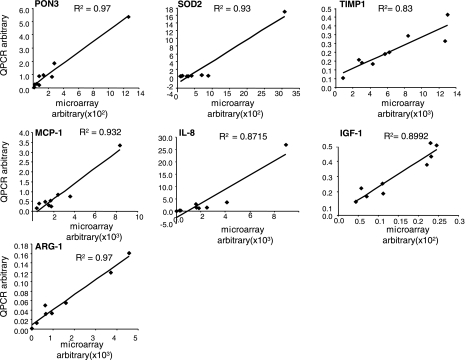
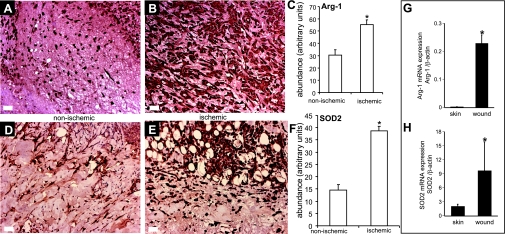
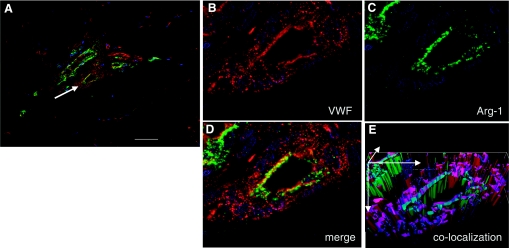
Chronic ischemic wounds presenting at wound clinics are heterogeneous with respect to etiology, age of the wound, and other factors complicating wound healing. In addition, there are ethical challenges associated with collecting repeated biopsies from a patient to develop an understanding of the temporal dynamics of the mechanisms underlying chronic wounds. The need for a preclinical model of ischemic wound is therefore compelling. The porcine model is widely accepted as an excellent preclinical model for human wounds. A full-thickness bipedicle flap approach was adopted to cause skin ischemia. Closure of excisional wounds placed on ischemic tissue was severely impaired resulting in chronic wounds. Histologically, ischemic wounds suffered from impaired re-epithelialization, delayed macrophage recruitment and poorer endothelial cell abundance and organization. Compared with the pair-matched nonischemic wound, unique aspects of the ischemic wound biology were examined on days 3, 7, 14, and 28 by systematic screening of the wound tissue transcriptome using high-density porcine GeneChips. Ischemia markedly potentiated the expression of arginase-1, a cytosolic enzyme that metabolizes the precursor of nitric oxide l-arginine. Ischemia also induced the SOD2 in the wound tissue perhaps as survival response of the challenged tissue. Human chronic wounds also demonstrated elevated expression of SOD2 and arginase-1. This study provides a thorough database that may serve as a valuable reference tool to develop novel hypotheses aiming to elucidate the biology of ischemic chronic wounds in a preclinical setting.


Figures

Fig. 1.
Fig. 1.
Wounding approach and skin perfusion pressure. A, B: 4 bipedicle flaps (15 × 5 cm) were developed on the back of domestic white swine. The flaps were freed from the underlying muscle and a sterile silicone sheet (15 × 5 cm) was placed under it to prevent readherence. The incised edges of the flap were sutured to the adjacent skin incorporating the silicone. Full-thickness excisional wounds were developed in the middle of each flap (filled circles) using a 8 mm disposable biopsy punch. Six additional paired wounds were developed similarly in the adjacent nonischemic skin (open circles). Arrows in A indicate direction of blood flow. Scale: the paper strip above the left lumbar flap in B is 10 cm long. C: skin perfusion pressure (SPP) was measured at locations adjacent to the ischemic as well as paired nonischemic wounds. ⧫, The cuff pressure where subcutaneous microcirculation was restored. D: SPP from nonischemic and ischemic wounds. Data are means ± SD (n = 3); *P < 0.01.
Fig. 2.
Fig. 2.
Characterization of wound-site ischemia and hypoxia. A: photographic (top) and Doppler (bottom) images of the back of swine with ischemic flaps and skin with intact perfusion. Nonischemic (2) and ischemic wound (1, 3) locations are marked; B: laser Doppler image of an ischemic flap on day 0 postwounding. C: wound tissue oxygen saturation and oximetry performed using a hyperspectral scanner (C, D) or OxyLite (E). C: representative photographic (left) and corresponding hyperspectral images (right) from nonischemic (top) and ischemic (bottom) wounds captured using a OxyVu2 hyperscpectral imaging system. The white circle and black arrows represent the hyperspectral target used for imaging. D: quantification of tissue oxygen saturation values from nonischemic and ischemic wounds as shown in C. Data are means ± SD (n = 4); *P < 0.01. E: wound-bed tissue Po2 was measured using OxyLite based on fluorescence quenching principle. d, Day. Data are means ± SD (n = 4), *P < 0.05.
Fig. 3.
Fig. 3.
Impaired wound closure in ischemic wounds. A: closure in nonischemic (•) and paired ischemic (▪) wounds. Data are shown as percentage of the initial wound area. Data are means ± SD (n = 4). *P < 0.05 compared with time zero postwounding. B: images of skin containing nonischemic (left) and paired ischemic (right) wound 31 days after wounding.
Fig. 4.
Fig. 4.
Impaired re-epithelialization of ischemic wounds. Wound-edge tissues were collected at the indicated time points after wounding. Formalin-fixed paraffin-embedded wound biopsies were sectioned (5 μm) and stained using the following approaches: A: Masson's trichrome procedure. This results in blue-black nuclei and blue collagen and cytoplasm. Epidermal cells appear reddish. Mosaic images showing nonischemic and ischemic wounds on days 3 and 7 after wounding. The mosaic images of whole wounds were collected under ×20 magnification guided by MosaiX software (Zeiss) and a motorized stage. Each mosaic image was generated by combining 12–15 images. Boxed area marks the wound-edge region of the tissue shown in B. HE, hyperproliferative epithelium; FP, fibrin plug. B: keratin 14 (K14) immunofluorescence staining. K14 (green) is known to specifically stain keratinocytes (basal layer). Marked impairment of re-epithelialization was noted in ischemic wounds in both days 3 and 7 postwounding compared with corresponding non ischemic wounds. C: quantitation of re-epithelialization in Mason trichrome stained ischemic and nonischemic wounds on days 3 and 7 postwounding. Re-epithelialization was determined by measuring the original width of the wound (W) and then measuring the portions of the wound that had re-epithelialized (E). Using the re-epithelialized area as the numerator and the original width as the denominator and multiplying by 100 gives the percentage of the wound re-epithelialized (E/W) × 100 = percent re-epithelialization. Data are means ± SD (n = 3); *P < 0.05.
Fig. 5.
Fig. 5.
Dysregulated macrophage infiltration in ischemic wounds. Wound-edge tissues were collected at the indicated time points after wounding. Formalin-fixed paraffin-embedded biopsy tissues were sectioned (5 μm) and stained using L1 macrophage/calprotectin immunostaining (brown). A: representative images of ischemic (right) and nonischemic (left) wounds showing macrophages (brown). The tissue sections were counterstained with hematoxylin (blue). HE, hyperproliferative epithelium; GT, granulation tissue; WE, wound-edge orientation; B: kinetics of macrophage infiltration in the nonischemic (solid line, ⧫) and ischemic wounds (dotted line, ▪). Relative quantification (arbitrary units) of macrophages in the tissue sections obtained 3–28 days postwounding was performed using an image processing tool kit. Data are means ± SD (n = 3). *P < 0.05.
Fig. 6.
Fig. 6.
Endothelial cell abundance is limited in ischemic wounds. Wound-edge tissues were collected at the indicated time points after wounding. Formalin-fixed paraffin-embedded biopsy tissues were sectioned (5 μm) and stained using von Willebrand Factor (brown) and counterstained with hematoxylin (blue). Compared with nonischemic wounds, ischemic wounds showed fewer organized endothelial cell clusters (A). In addition, endothelial cell abundance was poorer in the ischemic wounds (solid bars) compared with nonischemic (open bars) at both time points studied (B). Data are means ± SD (n = 3). *P < 0.05.
Fig. 7.
Fig. 7.
GeneChip data analysis scheme used to identify the kinetics of differentially expressed genes in nonischemic and ischemic wounds. Image acquisition and processing was performed using GCOS (GeneChip operating software, Affymetrix). GC-RMA was applied for data normalization. ArrayAssist v. 5.1 software was used to identify significant (P < 0.05; false discovery rate corrected) differentially expressed genes in nonischemic wound tissue compared with skin (0 h). The list of wound-sensitive genes thus obtained was queried for differential expression under ischemic vs. nonischemic conditions. The numbers of such wound-responsive ischemia-sensitive transcripts are indicated at the bottom together with a percentage value that represents the fraction of the total number of wound-responsive transcripts that were ischemia-sensitive for the corresponding time point after wounding.
Fig. 8.
Fig. 8.
Heat map illustrating cluster of transcripts that were wound-sensitive in nonischemic wounds. All wound-sensitive transcripts were subjected to hierarchical clustering. A: 6 major clusters (af) of transcripts that were upregulated during the temporal course of healing were identified. B: 1 major cluster of genes that was downregulated during the temporal course of healing was also identified. Annotated (according to Affymetrix and Gene Ontology) members of these clusters are listed in Supplemental Table S1. N, nonischemic.
Fig. 9.
Fig. 9.
Heat map illustrating cluster of wound-responsive transcripts that were sensitive to ischemia. All wound-sensitive transcripts were subjected to hierarchical clustering. Nine (ai) major clusters of transcripts were identified over the 4 different time points studied. Annotated (according to Affymetrix and Gene Ontology) members of these clusters are listed in Supplemental Table S3. IS, ischemic.
Fig. 10.
Fig. 10.
Validation of ischemia-sensitive candidate genes derived from microarray analyses. Expression levels of selected genes identified using GeneChip analyses were independently determined using real-time quantitative (Q) PCR. Simple regression was used to examine the relationship between QPCR and microarray data. Data obtained from microarray analysis is plotted against QPCR results for each candidate. The regression is derived from the mean of data obtained from ischemic and nonischemic wounds from all 4 time points. All data represent means ± SD (n = 4). IL-8, interleukin-8; IGF-1, insulin-like growth factor-1; PON3, paraoxonase 3; MCP-1, monocyte chemoattractant protein 1; SOD2, superoxide dismutase 2, mitochondrial; TIMP1, matrix metalloproteinase, tissue inhibitor 1; ARG-1, arginase-1.
Fig. 11.
Fig. 11.
Immunohistochemical validation of 2 ischemia-sensitive candidate genes Arg-1 and mitochondria superoxide dismutase (SOD2). Wound-edge tissues were collected on day 3 (SOD2) or day 7 (Arg-1) after wounding. Formalin-fixed paraffin-embedded biopsy tissues were sectioned (5 μm) and immunostained [diaminobenzidine (DAB) detection with hematoxylin counterstain] with antibodies against either arginase 1 (anti-Arg-1) or SOD2 (anti-SOD2) after heat-induced epitope retrieval. The brown coloration indicates positive staining (A and B, D and E). C, F: the area of DAB stain was estimated using Adobe Photoshop 6.0 employing a color subtractive process. Data are means ± SD (n = 3). *P < 0.05. Expression of Arg-1 (G) and SOD2 (H) in human skin and wound-edge tissue collected from chronic wounds. Quantitative real-time PCR was performed. Data are mean ± SD (n = 4). *P < 0.05.
Fig. 12.
Fig. 12.
Localization of arginase-1 in wound vessels. Wound-edge tissues were collected on day 7 after wounding. OCT-embedded frozen biopsy tissues were sectioned (10 μm) and immunostained simultaneously with antibodies against arginase 1 (anti-arg-1, green) and von Willebrand factor (vWF; endothelial cells, red). A: representative immunostained section of a wound showing blood vessels (red) and Arg-1 staining (green). The scale bar = 50 μm. B: a zoomed image of VWF-stained (red) blood vessel as shown in A with white arrow. C: expression of Arg-1 (green). D: merged (vWF and Arg-1) image showing colocalization of Arg-1 in VWF-positive areas. E: to have a better visualization of the colocalization, the section was also imaged in the Z-plane (1 μm increments). The Z-images were stacked, and the merged red and green channels were visualized in 3 dimensions using Axiovision Inside4D module (Zeiss).

References

    1. Abd-El-Aleem SA, Ferguson MW, Appleton I, Kairsingh S, Jude EB, Jones K, McCollum CN, Ireland GW. Expression of nitric oxide synthase isoforms and arginase in normal human skin and chronic venous leg ulcers. J Pathol 191: 434–442, 2000. - PubMed
    1. Becker F, Raoux MH, Brenot R, David M. Predictive value of TcPO2 in chronical severe ischemia of lower limbs. Int J Microcir Clin Exp 7: 261–271, 1988.
    1. Bement WM, Forscher P, Mooseker MS. A novel cytoskeletal structure involved in purse string wound closure and cell polarity maintenance. J Cell Biol 121: 565–578, 1993. - PMC - PubMed
    1. Bernatchez SF, Parks PJ, Grussing DM, Matalas SL, Nelson GS. Histological characterization of a delayed wound healing model in pig. Wound Repair Regen 6: 223–233, 1998. - PubMed
    1. Broughton G 2nd, Janis JE, Attinger CE. The basic science of wound healing. Plast Reconstr Surg 117: 12S–34S, 2006. - PubMed

Publication types

MeSH terms