. 2009;4(3):e4857.
doi: 10.1371/journal.pone.0004857. Epub 2009 Mar 18.

Host genetic background strongly influences the response to influenza a virus infections

Affiliations

Host genetic background strongly influences the response to influenza a virus infections

Barkha Srivastava et al. PLoS One. 2009.

Abstract

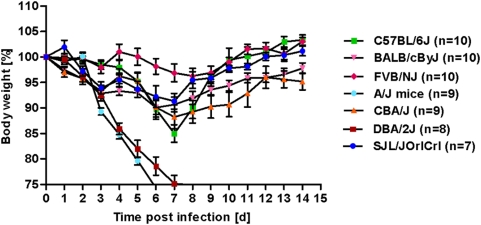
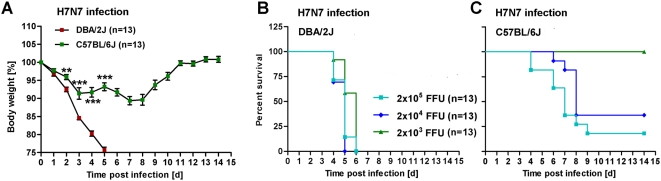
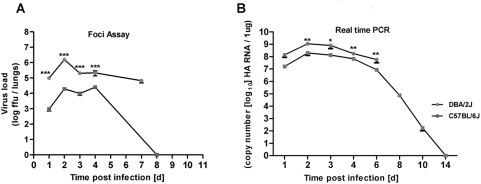
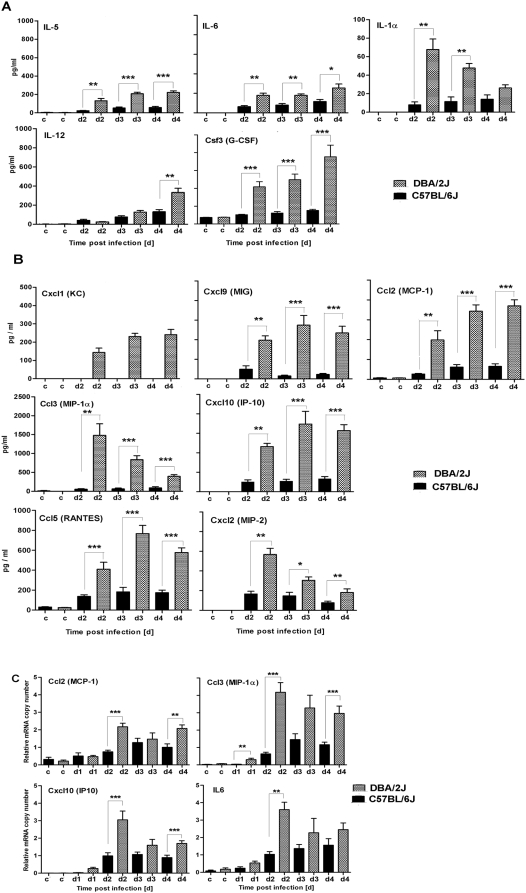
The genetic make-up of the host has a major influence on its response to combat pathogens. For influenza A virus, several single gene mutations have been described which contribute to survival, the immune response and clearance of the pathogen by the host organism. Here, we have studied the influence of the genetic background to influenza A H1N1 (PR8) and H7N7 (SC35M) viruses. The seven inbred laboratory strains of mice analyzed exhibited different weight loss kinetics and survival rates after infection with PR8. Two strains in particular, DBA/2J and A/J, showed very high susceptibility to viral infections compared to all other strains. The LD(50) to the influenza virus PR8 in DBA/2J mice was more than 1000-fold lower than in C57BL/6J mice. High susceptibility in DBA/2J mice was also observed after infection with influenza strain SC35M. In addition, infected DBA/2J mice showed a higher viral load in their lungs, elevated expression of cytokines and chemokines, and a more severe and extended lung pathology compared to infected C57BL/6J mice. These findings indicate a major contribution of the genetic background of the host to influenza A virus infections. The overall response in highly susceptible DBA/2J mice resembled the pathology described for infections with the highly virulent influenza H1N1-1918 and newly emerged H5N1 viruses.


Conflict of interest statement

Competing Interests: The authors have declared that no competing interests exist.

Figures

Figure 1
Figure 1. Different inbred laboratory mouse strains exhibit variable kinetics of weight loss and survival after infection with Influenza A virus.
C57BL/6J, DBA/2J, FVB/NJ, CBA/J, BALB/cByJ, A/J and SJL/JOrlCrl mice were infected intra-nasally with 2×10³ FFU of PR8 virus. Weight loss and survival of infected mice was followed over a period of 14 days. Mortality also includes mice that were sacrificed because they had lost more than 25% of body weight. Mean percent of body weight change (±SEM) for each group of inbred strains is shown. For DBA/2J and C57BL/6J mice, data are from two independent experiments. Statistical analysis of pair wise comparisons for all strains and days are presented in table 1.
Figure 2
Figure 2. (C57BL/6J×DBA/2J) F1 mice display an intermediate phenotype after infection with Influenza A virus and DBA/2NHsd exhibit the same susceptibility as DBA/2J.
C57BL/6J, DBA/2J, DBA/2NHsd and (C57BL/6J×DBA/2J) F1 (labeled B6D2F1 in the figure) mice were infected intra-nasally with 2×10³ FFU PR8 virus. Weight loss and survival of infected mice was followed over a period of 14 days. Mortality also includes mice that were sacrificed because they had lost more than 25% of body weight. Mean percent of body weight change (±SEM) are shown. For DBA/2J, C57BL/6J, and B6D2F1, data from two independent experiments were combined. p-values for significance were calculated for pair wise comparisons between all strains and for all days using non-parametric Mann-Whitney-U-test. The (C57BL/6J×DBA/2J) F1 group differed significantly in weight loss from days 2–4 when compared to the C57BL/6J group (p<0.001 on days 2, 3; p<0.01 on day 4) and from days 3–5 when compared to the DBA/2J and DBA/2NHsd groups (p<0.01). On days 2–5, DBA/2J and DBA/2NHsd strains differed significantly in their weight loss from C57BL/6J (p<0.001 for all cases, except p<0.01 at day 5 for DBA/2NHsd vs. C57BL/6J). Weight loss was not significantly different between the sub-strains DBA/2J and DBA/2NHsd groups for all days.
Figure 3
Figure 3. DBA/2J mice are highly susceptible to PR8 infections compared to C57BL/6J mice.
DBA/2J (A) and C57BL/6J (B) mice were infected with increasing doses of PR8 virus via the intranasal route and survival was recorded for the following 14 days. Mortality includes also mice that were sacrificed because they had lost more than 25% of body weight.
Figure 4
Figure 4. Male and female mice of DBA/2J and C57BL/6J mice show similar weight loss and survival after infection with Influenza A virus.
DBA/2J female, DBA/2J male, C57BL/6J female and C57BL/J male were infected intra-nasally with 2×10³ FFU PR8 virus. Weight loss and survival of infected mice was followed over a period of 14 days. Mortality includes also mice that were sacrificed because they had lost more than 25% of body weight. Mean percent of body weight change (±SEM) is shown. p-values for significance were calculated for pair wise comparison between all groups and for all days using non-parametric Mann-Whitney-U-test. On days 2–4, all DBA/2J male and female groups differed significantly in their weight loss from the C57BL/6J groups (p<0.001 for all comparisons). No consistently significant difference was observed between male and female C57BL/6J groups (except at day 4, p<0.05), whereas the male and female DBA/2J groups were significantly different at days 2–4 (p<0.05 at day 2 and p<0.01 at days 3, 4).
Figure 5
Figure 5. DBA/2J mice are highly susceptible to H7N7 (SC35M) virus infection compared to C57BL/6J mice.
(A): DBA/2J and C57BL/6J mice were infected intra-nasally with 2×10³ FFU SC35M virus. DBA/2J (B) and C57BL/6J (C) mice were infected with increasing doses of SC35M (H7N7) virus via the intra-nasal route. Weight loss and survival of infected mice was followed over a period of 14 days. Mortality includes also mice that were sacrificed because they had lost more than 25% of body weight. Data are from two independent experiments. Mean percent of body weight change (±SEM) is shown. DBA/2J and C57BL/6J groups were compared for statistically significant differences using non-parametric Mann-Whitney-U-test. *: p value<0.05; **: p<0.01; ***: p value<0.001.
Figure 6
Figure 6. Higher viral load is detected in DBA/2J mice compared to C57BL/6J mice.
DBA/2J and C57BL/6J mice were infected intra-nasally with 2×10³ FFU and viral load was determined at the indicated times post inoculation for infectious particles measured by foci assay (A) or by copy number of viral hemagglutinin (HA) RNA (B). Mean +/− SEM are shown. For foci assay in (A), 9 DBA/2J mice were used at all time points, and for C57BL/6J, 6 mice were used at day1, 8 mice at day 2 and 9 mice at days 3, 4, and 8. For RNA assays in (B), 10 mice were used except 15 for day 4, and 5 for day 6. DBA/2J and C57BL/6J mice were compared for statistical significant differences using non-parametric Mann-Whitney-U-test. *: p value<0.05; **: p<0.01; ***: p value<0.001.
Figure 7
Figure 7. DBA/2J mice exhibit a stronger inflammatory response than C57BL/6J mice.
DBA/2J (checked bars) and C57BL/6J mice (black bars) were infected intra-nasally with 2×10³ FFU of PR8 virus. Bronchio-alveolar lavage (BAL) was collected from non-infected controls (c) or at the indicated days (d1, d2, d3, d4) post infection, and the concentration of cytokines (A) or chemokines (B) was determined. Expression of cytokines and chemokines was determined by real-time PCR (C). Each time point represents the mean value ±SEM of 7 mice per group for (A) and (B), and of 10 mice per group for (C). DBA/2J and C57BL/6J mice were compared for statistically significant differences using non-parametric Mann-Whitney-U-test. *: p value<0.05; **: p<0.01; ***: p value<0.001.
Figure 8
Figure 8. Severe damage of bronchial epithelia occurs in DBA/2J compared to C57BL/6J mice.
DBA/2J (A, C, E) and C57BL/6J mice (B, D, F) were infected intra-nasally with 2×10³ FFU of PR8 virus. Lung sections were stained with hematoxylin and eosin. A, B: Two days after infection, the lungs of DBA/2J mice (A) were more consolidated with higher numbers of plugged airways (arrows) than C57BL/6J mice (B). C, D: The bronchioli and bronchi of DBA/2J mice (C) were plugged with degenerate bronchial epithelial cells and neutrophils with higher degrees of degeneration, necrosis and loss of epithelial cells (arrows) two days after infection. In addition, the airways were surrounded by larger numbers of neutrophils and macrophages (asterisks). Airways of C57BL/6J mice (D) showed less damage with little or no plugging of airways. At that time point, the lungs of both strains had few infiltrations with lymphocytes. E, F: Four days after infection, virtually no extravasations of lymphocytes were detected in DBA/2J mice (E) whereas marked perivascular lymphocytic infiltrations (arrows) were observed in the pulmonary interstitium of C57BL/6J mice (F). Bars  =  250 µm (A, B), 25 µm (C, D) and 50 µm (E, F).

References

    1. Johnson NP, Mueller J. Updating the accounts: global mortality of the 1918–1920 “Spanish” influenza pandemic. Bull Hist Med. 2002;76:105–115. - PubMed
    1. Kilbourne ED. Influenza pandemics of the 20th century. Emerg Infect Dis. 2006;12:9–14. - PMC - PubMed
    1. Rajagopal S, Treanor J. Pandemic (avian) influenza. Semin Respir Crit Care Med. 2007;28:159–170. - PubMed
    1. Fauci AS. Seasonal and pandemic influenza preparedness: science and countermeasures. J Infect Dis. 2006;194(Suppl 2):S73–76. - PubMed
    1. La Gruta NL, Kedzierska K, Stambas J, Doherty PC. A question of self-preservation: immunopathology in influenza virus infection. Immunol Cell Biol. 2007;85:85–92. - PubMed

Publication types