. 2009;4(3):e4889.
doi: 10.1371/journal.pone.0004889. Epub 2009 Mar 18.

Enterohemorrhagic Escherichia coli O157:H7 gene expression profiling in response to growth in the presence of host epithelia

Affiliations

Enterohemorrhagic Escherichia coli O157:H7 gene expression profiling in response to growth in the presence of host epithelia

Narveen Jandu et al. PLoS One. 2009.

Abstract

Background: The pathogenesis of enterohemorrhagic Escherichia coli (EHEC) O157:H7 infection is attributed to virulence factors encoded on multiple pathogenicity islands. Previous studies have shown that EHEC O157:H7 modulates host cell signal transduction cascades, independent of toxins and rearrangement of the cytoskeleton. However, the virulence factors and mechanisms responsible for EHEC-mediated subversion of signal transduction remain to be determined. Therefore, the purpose of this study was to first identify differentially regulated genes in response to EHEC O157:H7 grown in the presence of epithelial cells, compared to growth in the absence of epithelial cells (that is, growth in minimal essential tissue culture medium alone, minimal essential tissue culture medium in the presence of 5% CO(2), and Penassay broth alone) and, second, to identify EHEC virulence factors responsible for pathogen modulation of host cell signal transduction.

Methodology/principal findings: Overnight cultures of EHEC O157:H7 were incubated for 6 hr at 37 degrees C in the presence or absence of confluent epithelial (HEp-2) cells. Total RNA was then extracted and used for microarray analyses (Affymetrix E. coli Genome 2.0 gene chips). Relative to bacteria grown in each of the other conditions, EHEC O157:H7 cultured in the presence of cultured epithelial cells displayed a distinct gene-expression profile. A 2.0-fold increase in the expression of 71 genes and a 2.0-fold decrease in expression of 60 other genes were identified in EHEC O157:H7 grown in the presence of epithelial cells, compared to bacteria grown in media alone.

Conclusion/significance: Microarray analyses and gene deletion identified a protease on O-island 50, gene Z1787, as a potential virulence factor responsible for mediating EHEC inhibition of the interferon (IFN)-gamma-Jak1,2-STAT-1 signal transduction cascade. Up-regulated genes provide novel targets for use in developing strategies to interrupt the infectious process.


Conflict of interest statement

Competing Interests: The authors have declared that no competing interests exist.

Figures

Figure 1
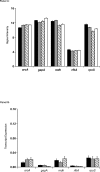
Figure 1. Relative expression of EHEC O157∶H7, strain CL56 housekeeping genes in response to different growth conditions.
[Panel A] Signal intensities of housekeeping genes (arcA, gapA, mdh, rfbA and rpoS) from microarray chips in response to EHEC O157∶H7 grown under four different conditions. All housekeeping genes showed similar levels of expression, irrespective of the bacterial growth condition. Data are presented as means±SEM. [Panel B] qRT-PCR of the same housekeeping genes confirms comparable levels of transcript expression, irrespective of EHEC O157∶H7 growth condition. Data points from triplicates of EHEC O157∶H7 grown in contact with epithelial cells, microbial growth in minimal essential medium (+/−5% CO2) were extrapolated from a standard curve generated for each primer pair using samples of the same bacterial strain grown in Penassay broth alone. As described in the Experimental procedures, data analysis was performed using the 7500 Sequence Detection System Software package (Applied Biosystems). Black bars represent EHEC O157∶ H7 grown in the presence of epithelial cells; grey bars: pathogen grown in minimal essential medium in atmospheric conditions or in 5% CO2 (stripped bars). EHEC grown in Penassay broth are shown in white bars [Panel A].
Figure 2
Figure 2. Volcano plot showing differential expression of EHEC O157∶H7, strain CL56 genes during bacterial growth in the presence of epithelial cells, relative to the absence of epithelial cells.
Data points were extracted from a 1-way analysis of variance (ANOVA): Gene expression changes during EHEC growth in the presence of cultured epithelial cells, relative to pathogen growth in the absence of epithelial cells. The x-axis represents ‘log fold change’ and the corresponding dark vertical lines represent cut-offs at log2.0-fold decreases and increases. The y-axis represents p-values and the corresponding dark horizontal lines indicate a p value cut-off of 0.05. Values presented represent the number of down- and up-regulated genes, respectively.
Figure 3
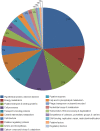
Figure 3. Functional classification of the 131 differentially regulated genes during EHEC O157∶H7 growth in the presence of epithelial cells, relative to the absence of epithelial cells, as summarized in a pie chart .
Each pie slice represents a major functional group of genes. Numbers shown represent percentage.
Figure 4
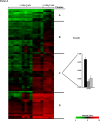
Figure 4. Hierarchical cluster plot showing relative expression patterns of EHEC O157∶H7 up-regulated genes in the presence of epithelial cells, relative to the absence of epithelial cells [Panel A].
Horizontal rows represent distinct genes and vertical columns represent individual samples of EHEC O157∶H7 grown in the presence of epithelial cells [(+) HEp-2], relative to the absence of epithelial cells [(−) HEp-2]. Relative expression patterns of EHEC O157∶H7, strain CL56 gene Z1787 [Panel B]. qRT-PCR of Z1787 showing differences in transcript expression for EHEC O157∶H7 under varying growth condition. Data points are derived from triplicates of EHEC O157∶H7 grown in epithelial cells versus microbial growth in minimal essential medium (−/+5% CO2) were extrapolated from a standard curve generated for each primer pair using EHEC O157∶H7 grown in Penassay broth. Data analysis was performed using the 7500 Sequence Detection System Software package (Applied Biosystems). Black bars represent EHEC O157∶ H7 grown in the presence of HEp-2 cells; grey bars represent the pathogen grown in minimal essential medium in room air; stripped bars represent microbial growth in minimal essential medium in 5% CO2.
Figure 5
Figure 5. Transcript expression of EHEC O157∶H7 gene Z1787 in wild-type and mutant strains.
As described in the Experimental procedures, gene deletion was performed using the Lambda Red technique –. Isogenic mutants were then screened and verified using reverse transcriptase polymerase chain reaction (RT-PCR). PCR products were electrophoresed on 2% agarose gel, stained with ethidium bromide, and bands then visualized under a UV lamp. The standard employed was a 100 bp ladder. Lane 1: negative water control; Lane 2: EHEC strain CL56; Lane 3: EPEC strain E2348/69; Lane 4: EHEC strain EDL 933 (parent to the mutant); Lane 5: ΔZ1787; Lane 6: no transcript control. [Panel A] transcript expression of EHEC gene Z1787; [Panel B] transcript expression of EHEC gapA. Primers are described in Table 2 of the Materials and Methods .
Figure 6
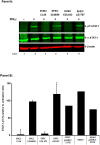
Figure 6. EHEC O157∶H7 gene Z1787 is a virulence factor responsible for inhibition of STAT-1 tyrosine phosphorylation.
Cultured epithelial cells were infected with wild-type EHEC O157∶H7, strains CL56 and strain EDL 933, EHEC ΔZ1787 (in strain EDL 933) and EPEC O127∶H6 (MOI 100∶1) for 6 hr (or as described in the Experimental procedures) at 37°C in 5% CO2. Washed cells were then stimulated with interferon (IFN)-γ (50 ng/mL) for 0.5 hr at 37°C in 5% CO2. Whole cell protein extracts were collected and immunoblots probed with either anti-latent-STAT-1 or anti-phospho-STAT-1 and anti-β-actin primary antibodies, followed by respective secondary antibodies. [Panel A] Positively staining bands were detected by using an infrared scanner. Lanes 1 & 2: uninfected epithelial cells in the absence and presence of interferon-γ, respectively; Lane 3: EHEC O157∶H7, strain CL56 inhibited STAT-1 tyrosine phosphorylation; Lanes 4: EPEC did not disrupt STAT-1 tyrosine phosphorylation. Lane 5: Wild-type EHEC O157∶H7, strain EDL933 inhibited IFNγ stimulated STAT-1 activation. Lane 6: Gene disruption of Z1787 in EDL 933 prevented EHEC subversion of STAT-1 signaling in response to IFNγ. [Panel B] Densitometry of positively stained bands was quantified using software imbedded in the infrared scanner. Quantification of STAT-1 tyrosine phosphorylation in epithelial cells infected with EHEC O157∶H7 complemented with gene Z1787 using the pGEM-T vector also was determined. As a positive control, levels of STAT-1 tyrosine phosphorylation also were determined in epithelial cells treated with non-pathogenic E. coli strain HB101: wild-type bacteria did not inhibit STAT-1 activation, while HB101+gene Z1787 (inserted on the pGEM-T vector) resulted in partially reduced levels of STAT-1 tyrosine phosphorylation (n = 1–4; ANOVA, *p<0.01).

References

    1. Kaper JB, Karmali MA. The continuing evolution of a bacterial 566 pathogen. Proc Natl Acad Sci U S A. 2008;105:4535–4536. - PMC - PubMed
    1. Tarr PI, Gordon CA, Chandler WL. Shiga-toxin-producing Escherichia coli and haemolytic uraemic syndrome. Lancet. 2005;365:1073–1086. - PubMed
    1. Serna AT, Boedeker EC. Pathogenesis and treatment of Shiga toxin-producing Escherichia coli infections. Curr Opin Gastroenterol. 2008;24:38–47. - PubMed
    1. Kaper JB, Nataro JP, Mobley HL. Pathogenic Escherichia coli. Nat Rev Microbiol. 2004;2:123–140. - PubMed
    1. Jandu N, Shen S, Wickham ME, Prajapati R, Finlay BB, et al. Multiple seropathotypes of verotoxin-producing Escherichia coli (VTEC) disrupt interferon gamma-induced tyrosine phosphorylation of signal transducer and activator of transcription (Stat)-1. Microb Pathog. 2007;42:62–71. - PubMed

Publication types

MeSH terms