. 2009 Mar;5(3):e1000414.
doi: 10.1371/journal.pgen.1000414. Epub 2009 Mar 13.

A human protein interaction network shows conservation of aging processes between human and invertebrate species

Affiliations

A human protein interaction network shows conservation of aging processes between human and invertebrate species

Russell Bell et al. PLoS Genet. 2009 Mar.

Abstract

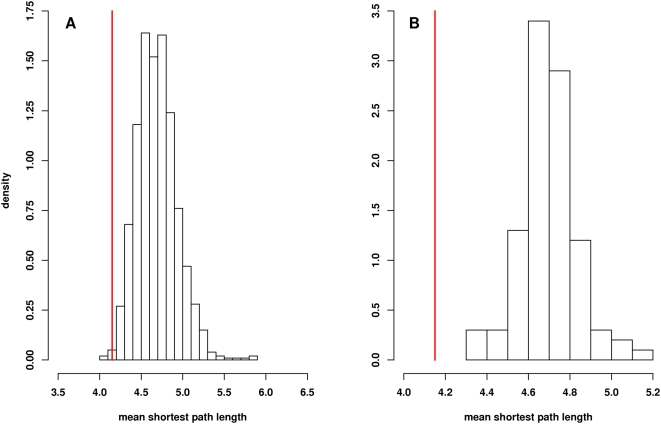
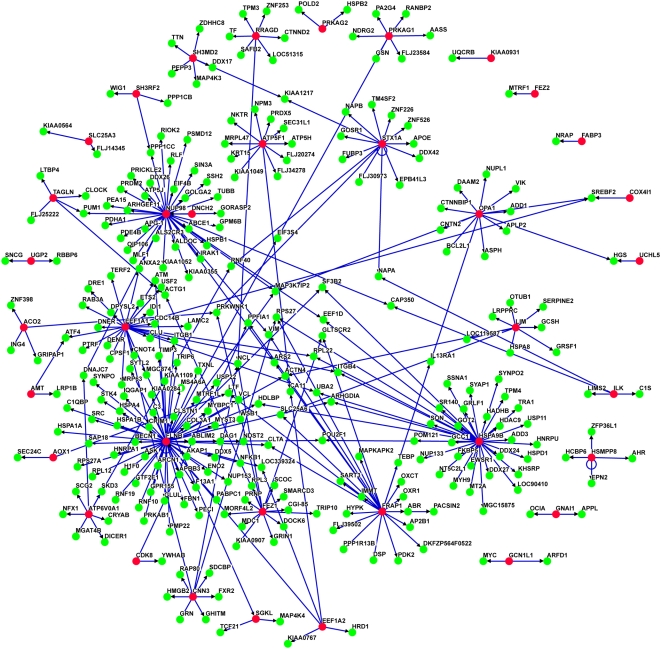
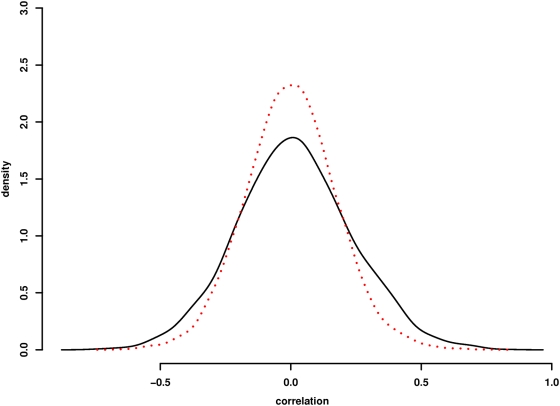
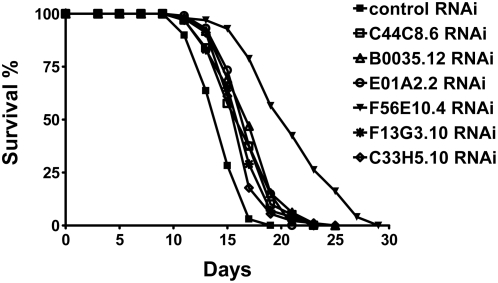
We have mapped a protein interaction network of human homologs of proteins that modify longevity in invertebrate species. This network is derived from a proteome-scale human protein interaction Core Network generated through unbiased high-throughput yeast two-hybrid searches. The longevity network is composed of 175 human homologs of proteins known to confer increased longevity through loss of function in yeast, nematode, or fly, and 2,163 additional human proteins that interact with these homologs. Overall, the network consists of 3,271 binary interactions among 2,338 unique proteins. A comparison of the average node degree of the human longevity homologs with random sets of proteins in the Core Network indicates that human homologs of longevity proteins are highly connected hubs with a mean node degree of 18.8 partners. Shortest path length analysis shows that proteins in this network are significantly more connected than would be expected by chance. To examine the relationship of this network to human aging phenotypes, we compared the genes encoding longevity network proteins to genes known to be changed transcriptionally during aging in human muscle. In the case of both the longevity protein homologs and their interactors, we observed enrichments for differentially expressed genes in the network. To determine whether homologs of human longevity interacting proteins can modulate life span in invertebrates, homologs of 18 human FRAP1 interacting proteins showing significant changes in human aging muscle were tested for effects on nematode life span using RNAi. Of 18 genes tested, 33% extended life span when knocked-down in Caenorhabditis elegans. These observations indicate that a broad class of longevity genes identified in invertebrate models of aging have relevance to human aging. They also indicate that the longevity protein interaction network presented here is enriched for novel conserved longevity proteins.


Conflict of interest statement

The authors have declared that no competing interests exist.

Figures

Figure 1
Figure 1. Node Degree Distributions in Core Network and Longevity Network.
Panel A shows the node degree distribution in unfiltered and Core protein interaction networks. A log-log plot of node degrees in both unfiltered and Core interaction networks appears as a straight line indicating that both are scale free. Black circles represent node degrees of 11,280 proteins in a network of 114,698 interactions. Red circles show the node degree distribution after removal of bait proteins with >87 interactions and prey proteins with >231 interactions. The Core Network contains 70,358 binary interactions among 10,425 unique proteins. Panel B shows the node degree distributions of the Core and longevity networks represented as box plots. The average node degree in the Core Network is 13.5. The average node degree for the 175 longevity proteins is 18.8. Median node degrees (indicated by thick horizontal lines) for the core and longevity networks are respectively 5.0 and 7.0.
Figure 2
Figure 2. Path length analysis of longevity genes in Core Network.
Panel A shows a comparison of the mean shortest path length of the 175 genes in the longevity cohort to the average shortest path length distribution in the Core Network. The histogram shows the distribution of mean shortest path lengths observed in 1,000 sets of 175 genes randomly selected from the 10,430 unique genes present as nodes in the Core Network. The mean shortest path length for all genes is 4.61. By comparison, the mean shortest path length for the 175 longevity genes is 4.15 (vertical red line). The p-value for the significance of this difference is 0.004. Panel B shows path length analysis for interactions among longevity homologs using randomized networks. The mean shortest path length between the 175 longevity protein homologs in the network is 4.15 (vertical red line). The distribution of mean shortest path lengths between these proteins in 100 networks with randomly assigned connections is shown. The peak of the distribution in the randomized networks is 4.73. As none of the values from the permutation distribution was less than 4.15, the p-value for the significance of this difference is <0.01.
Figure 3
Figure 3. Significance of gene expression changes for longevity gene homologs and interacting proteins.
The permutation distributions (based on 1,000 permutations of the array label) for the number of significant probes (based on FDR value in the association of age versus expression) for three different sets: A. human homologs of aging genes (based on 1,000 random draws of 291 probes), B. longevity gene homologs present in the interaction network (based on 1,000 random draws of 210 probes), and C. 1° interactor protein genes (based on 1,000 random draws of 2,507 probes). Vertical red lines indicate values (number of probes with FDR-based q-value<0.05) for the original experimental datasets from which the p-values of these three tests are derived.
Figure 4
Figure 4. Subset of Longevity Network including only those genes whose expression is significantly changed in young vs old human muscle.
Longevity gene homologs are shown in red; interacting proteins are shown in green. The network contains 339 interactions among 325 proteins.
Figure 5
Figure 5. Correlation of gene expression changes with binary protein interactions.
Distribution of transcriptional expression correlations for binary protein interaction pairs in the longevity network is shown in black. Distributions of correlation for randomized binary pairs is shown in red. The experimental network shows enrichment for both positively and negatively correlated binary pairs. Approximate inference via Two-sample Kolmogorov-Smirnov test confirms significant differences in the two distributions of correlations (p<0.00001).
Figure 6
Figure 6. Kaplan–Meier survival curves for C. elegans treated with RNAi knock-down of genes encoding homologs of six human FRAP1 interacting proteins.
Human homologs corresponding to nematode genes are as follows: MAPKAP2 (C44C8.6); SART3 (B0035.12); ARS2 (E01A2.2); RPS27 (F56E10.4); HYPK (F13G3.10); DKFZP564F0522 (C33H5.10).

References

    1. Fabrizio P, Pozza F, Pletcher SD, Gendron CM, Longo VD. Regulation of longevity and stress resistance by Sch9 in yeast. Science. 2001;292:288–290. - PubMed
    1. Friedman DB, Johnson TE. A mutation in the age-1 gene in Caenorhabditis elegans lengthens life and reduces hermaphrodite fertility. Genetics. 1988;118:75–86. - PMC - PubMed
    1. Promislow DE. Protein networks, pleiotropy and the evolution of senescence. Proc Biol Sci. 2004;271:1225–1234. - PMC - PubMed
    1. Ferrarini L, Bertelli L, Feala J, McCulloch AD, Paternostro G. A more efficient search strategy for aging genes based on connectivity. Bioinformatics. 2005;21:338–348. - PubMed
    1. Fields S, Song O. A novel genetic system to detect protein-protein interactions. Nature. 1989;340:245–246. - PubMed

Publication types