. 2010 Jan;20(1):113-24.
doi: 10.1002/hipo.20589.

Structural plasticity of dentate granule cell mossy fibers during the development of limbic epilepsy

Affiliations

Structural plasticity of dentate granule cell mossy fibers during the development of limbic epilepsy

Steve C Danzer et al. Hippocampus. 2010 Jan.

Abstract

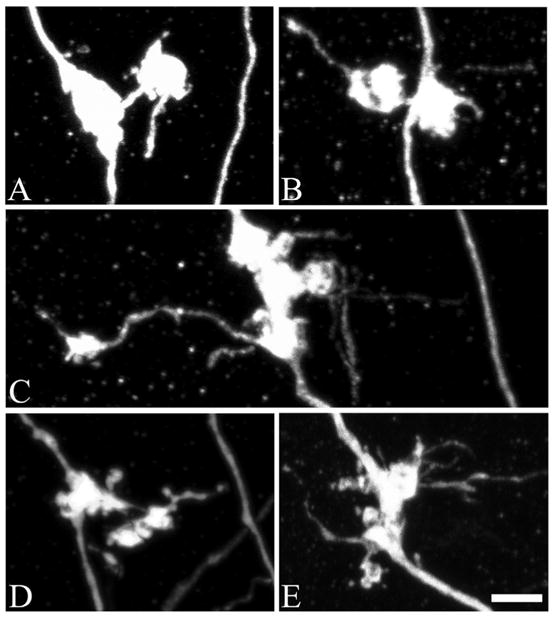
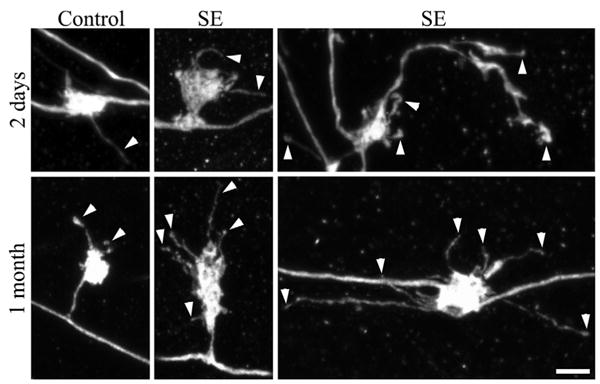
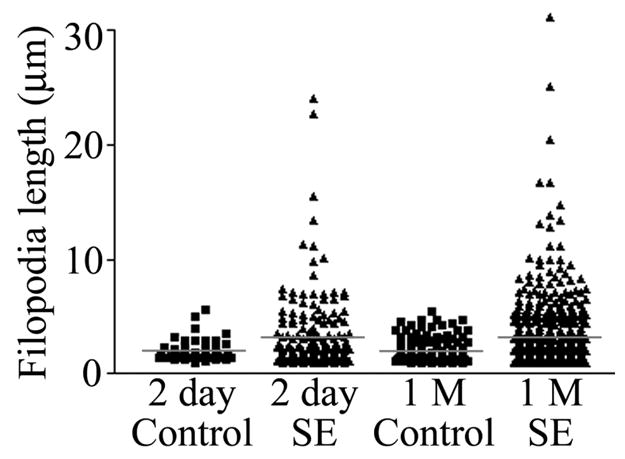
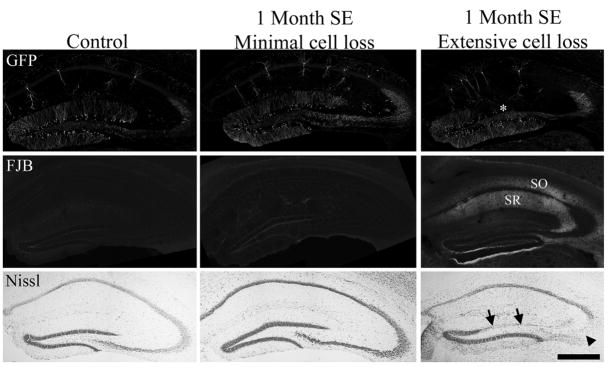
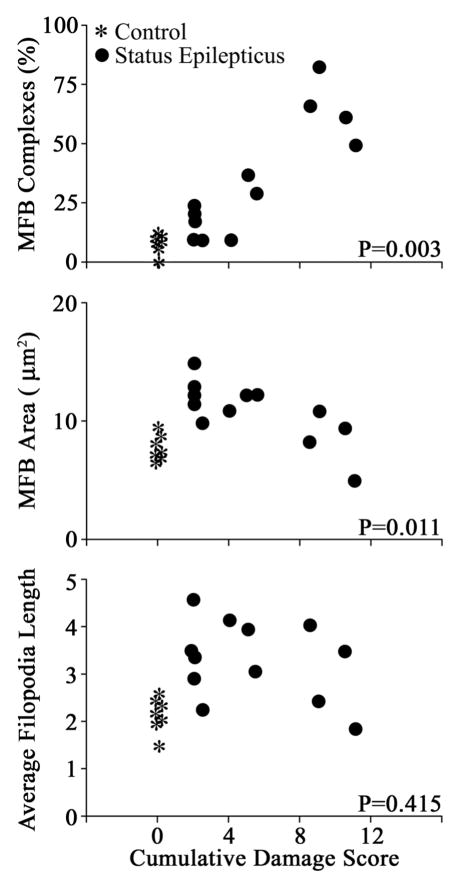
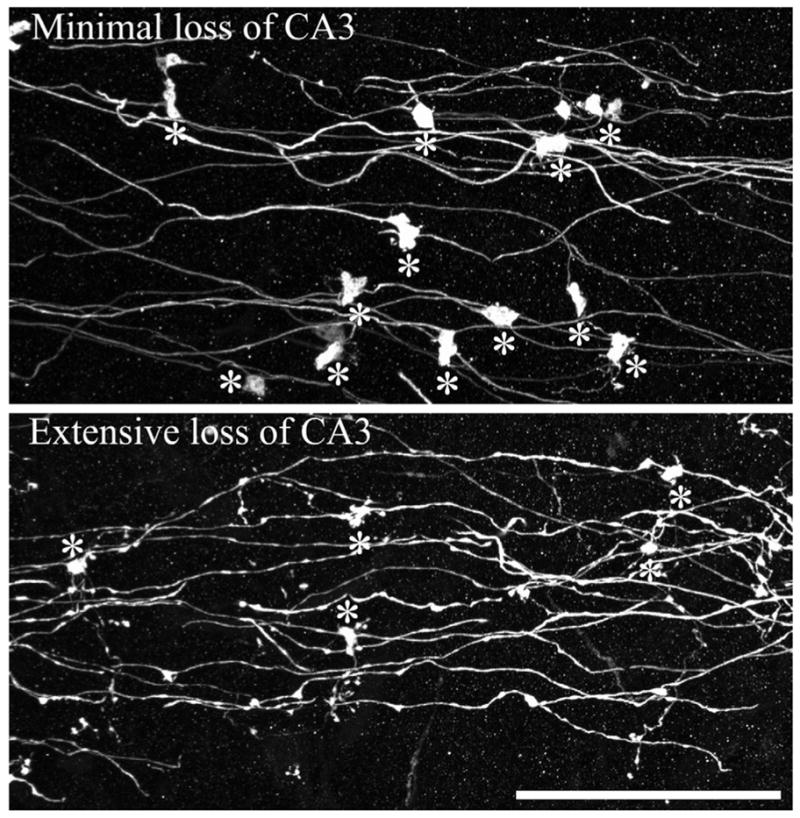
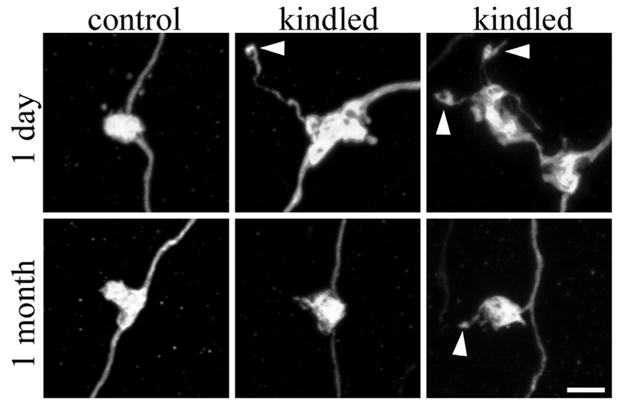
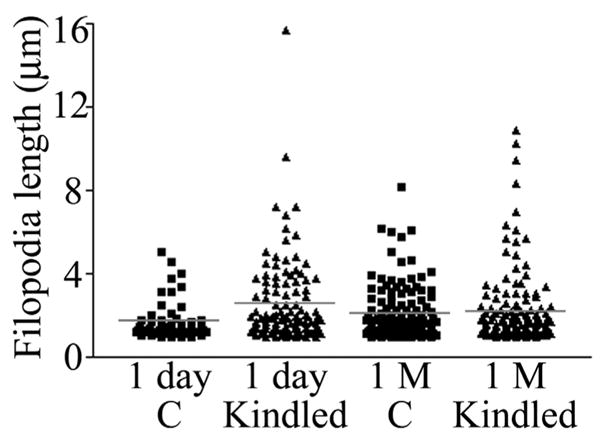
Altered granule cell>>CA3 pyramidal cell synaptic connectivity may contribute to the development of limbic epilepsy. To explore this possibility, granule cell giant mossy fiber bouton plasticity was examined in the kindling and pilocarpine models of epilepsy using green fluorescent protein-expressing transgenic mice. These studies revealed significant increases in the frequency of giant boutons with satellite boutons 2 days and 1 month after pilocarpine status epilepticus, and increases in giant bouton area at 1 month. Similar increases in giant bouton area were observed shortly after kindling. Finally, both models exhibited plasticity of mossy fiber giant bouton filopodia, which contact GABAergic interneurons mediating feedforward inhibition of CA3 pyramids. In the kindling model, however, all changes were fleeting, having resolved by 1 month after the last evoked seizure. Together, these findings demonstrate striking structural plasticity of granule cell mossy fiber synaptic terminal structure in two distinct models of adult limbic epileptogenesis. We suggest that these plasticities modify local connectivities between individual mossy fiber terminals and their targets, inhibitory interneurons, and CA3 pyramidal cells potentially altering the balance of excitation and inhibition during the development of epilepsy.


Figures

FIGURE 1
FIGURE 1
Confocal reconstructions of granule cell giant mossy fiber bouton complexes, which are comprised of a core giant bouton connected to one or more satellite boutons. A, An example of a giant mossy fiber bouton complex from a control animal. In controls, these complexes were rarely observed. B, Two days after status epilepticus, the incidence of giant mossy fiber boutons with satellites was increased 153% over control values (P = 0.049). C–E, One month after status, the percentage of giant mossy fiber boutons connected to satellite boutons was increased 461% over control values (P = 0.009). Scale bar = 3 μm. [Color figure can be viewed in the online issue, which is available at www.interscience.wiley.com.]
FIGURE 2
FIGURE 2
Confocal reconstructions of granule cell giant mossy fiber boutons. Giant boutons are from control animals and animals that underwent status epilepticus (SE) either 2 days or 1 month earlier. The 1 month animals shown exhibited minimal loss of hippocampal principal neurons after status epilepticus (Cumulative damage score = 2). Two days after status epilepticus, the number of filopodia per giant mossy fiber bouton was significantly increased (arrowheads). One month after status epilepticus, giant mossy fiber bouton area, the number of filopodia per giant mossy fiber bouton (arrowheads), and filopodia length were significantly increased relative to age-matched saline controls. Scale bar = 3 μm. [Color figure can be viewed in the online issue, which is available at www.interscience.wiley.com.]
FIGURE 3
FIGURE 3
Scatter plot depicting individual filopodia lengths from pilocarpine-treated animals killed 1 day and 1 month (1 M) after status epilepticus (SE). Corresponding control groups are shown as well. Red bars depict the means for each group. Means were generated from the average filopodia length for each animal rather than the raw data shown here (to avoid statistical analyses of nonindependent variables). Although average filopodia length was statistically increased only at the 1 month time point (P = 0.002), note the impressive increase in the number of very long filopodia following status at both time points. [Color figure can be viewed in the online issue, which is available at www.interscience.wiley.com.]
FIGURE 4
FIGURE 4
Fluoro-Jade B staining of hippocampal sections from a control animal and pilocarpine-treated animal sacrificed 2 days after status epilepticus (SE). Fluoro-Jade B staining was absent from control animals (top), whereas in pilocarpine-treated animals large numbers of labeled cells were present in the dentate hilus (h) and scattered cells were labeled throughout the CA1 and CA3 pyramidal cell layers. Scale bar = 300 μm. [Color figure can be viewed in the online issue, which is available at www.interscience.wiley.com.]
FIGURE 5
FIGURE 5
Green fluorescent protein (GFP), Fluoro-Jade B (FJB), and cresyl violet (Nissl) staining in a 1 month saline control mouse (left column) and mice 1 month after pilocarpine-induced status epilepticus (SE). The middle column shows sections from an animal with no detectable loss of dentate granule cells, CA3 pyramidal cells or CA1 pyramidal cells (cell loss score = 2 due to hilar damage). The right column shows sections from an animal (cell loss score = 8) with obvious loss of dentate granule cells (arrows) and CA3 pyramidal cells (arrowhead). Loss of GFP labeling, reflecting granule cell death, is also evident in the DG of this animal (asterisk). Fluoro-Jade B staining reveals degenerating fibers in stratum radiatum (SR) and stratum oriens (SO) of CA1 in this animal. Staining on the lower edge of the dentate and upper edge of the adjacent thalamus is artifactual (“edge artifact”). Scale bar = 500 μm. [Color figure can be viewed in the online issue, which is available at www.interscience.wiley.com.]
FIGURE 6
FIGURE 6
Scatter plots showing significant correlations between loss of hippocampal neurons and changes in granule cell morphology. Cumulative damage score equals the combined semi-quantitative cell loss scores for the DG, hilus, CA1, and CA3 pyramidal cell layers (no loss = 0; >90% loss in all four regions = 12). Among pilocarpine treated animals (black dots), cumulative damage scores were significantly correlated with the percentage of giant mossy fiber boutons with satellites (MFB complexes) and MFB area. Although control animals are depicted in the scatter plots (asterisks), they were not included in the statistical analyses used to generate significant correlations. In the case of MFB complexes, inclusion of control animals produced even stronger correlations, as is evident in the plot. In the case of MFB area, intriguingly, inclusion of control animals revealed a bimodal effect of cell loss. By way of contrast, although giant mossy fiber bouton filopodia length was significantly increased 1 month after status relative to controls, this variable exhibited no correlation with cell loss among pilocarpine-treated animals. Each symbol represents an individual animal.
FIGURE 7
FIGURE 7
Confocal reconstructions of dentate granule cell mossy fiber axons from animals collected 1 month after status epilepticus. Animals with minimal (top) and extensive (bottom) cell loss are shown. Asterisks denote giant mossy fiber boutons. Note the smaller size of giant boutons from the animal exhibiting extensive cell loss, and the beaded appearance of the attached axons. Scale bar = 40 μm. [Color figure can be viewed in the online issue, which is available at www.interscience.wiley.com.]
FIGURE 8
FIGURE 8
Confocal reconstructions of granule cell giant mossy fiber boutons. Giant boutons are from control animals and amygdala-kindled animals either 1 day or 1 month after the last evoked seizure. One day after the last evoked seizure, giant mossy fiber bouton area, the number of filopodia per giant mossy fiber bouton (arrowheads), and the length of these filopodia were significantly increased relative to control animals. These changes, however, were transient. One month after the last evoked seizure, giant mossy fiber boutons from kindled animals were indistinguishable from controls. Scale bar = 3 μm. [Color figure can be viewed in the online issue, which is available at www.interscience.wiley.com.]
FIGURE 9
FIGURE 9
Scatter plot depicting individual filopodia lengths from control animals (C) and kindled animals sacrificed 1 day and 1 month (1 M) after the last evoked seizure. Mean filopodia length (red bar) was significantly increased 1 day, but not 1 month, after the last evoked seizure. Notably, although mean filopodia length was increased, the longest filopodia were still only half the length of the longest filopodia observed in animals exposed to status epilepticus (compared with Fig. 3). [Color figure can be viewed in the online issue, which is available at www.interscience.wiley.com.]

References

    1. Acsády L, Kamondi A, Sík A, Freund T, Buzsáki G. GABAergic cells are the major postsynaptic targets of mossy fibers in the rat hippocampus. J Neurosci. 1998;18:3386–3403. - PMC - PubMed
    1. Amaral DG. Synaptic extensions from the mossy fibers of the fascia dentata. Anat Embryol (Berl) 1979;155:241–251. - PubMed
    1. Amaral DG, Dent JA. Development of the mossy fibers of the dentate gyrus: I. A light and electron microscopic study of the mossy fibers and their expansions. J Comp Neurol. 1981;195:51–86. - PubMed
    1. Amaral DG, Scharfman HE, Lavenex P. The dentate gyrus: Fundamental neuroanatomical organization (dentate gyrus for dummies) Prog Brain Res. 2007;163:3–22. - PMC - PubMed
    1. André V, Marescaux C, Nehlig A, Fritschy JM. Alterations of hippocampal GAbaergic system contribute to development of spontaneous recurrent seizures in the rat lithium-pilocarpine model of temporal lobe epilepsy. Hippocampus. 2001;11:452–468. - PubMed

Publication types

MeSH terms

Substances