

Relationship between obstructive sleep apnea severity and brain activation during a sustained attention task
- PMID: 19294957
- PMCID: PMC2647791
- DOI: 10.1093/sleep/32.3.373
Relationship between obstructive sleep apnea severity and brain activation during a sustained attention task
Abstract
Study objectives: The objectives of this study were to (1) characterize cognitive and cerebral correlates of attention and response speed in patients with obstructive sleep apnea (OSA) and (2) assess the association of performance and brain activation with measures of OSA severity.
Design: Patients with OSA and controls were compared on performance and brain activation during a sustained attention task. The association of reaction time and brain activation with apnea-hypopnea index, nocturnal hypoxia, and arousals was assessed.
Setting: Functional magnetic resonance imaging was conducted while participants performed a Go-No-Go task. The 'Go' trials of the Go-No-Go task were used to index attention processing.
Participants: Fourteen patients with OSA and 14 normal control subjects with equivalent age, body mass index, blood pressure, and education.
Interventions: N/A.
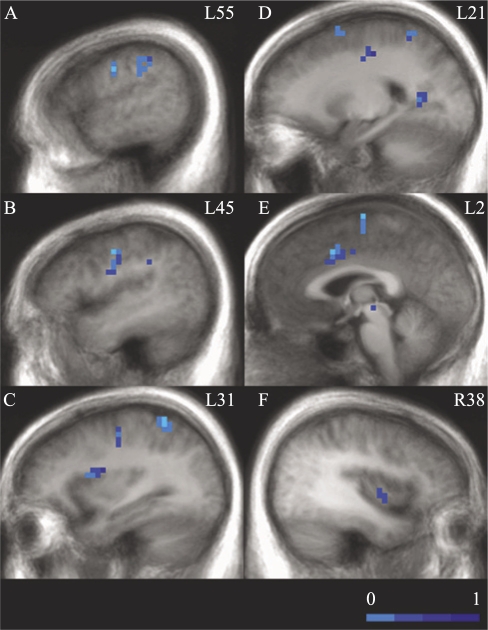
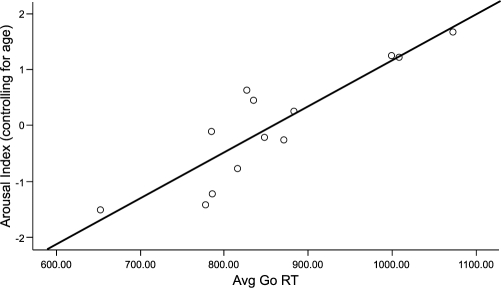
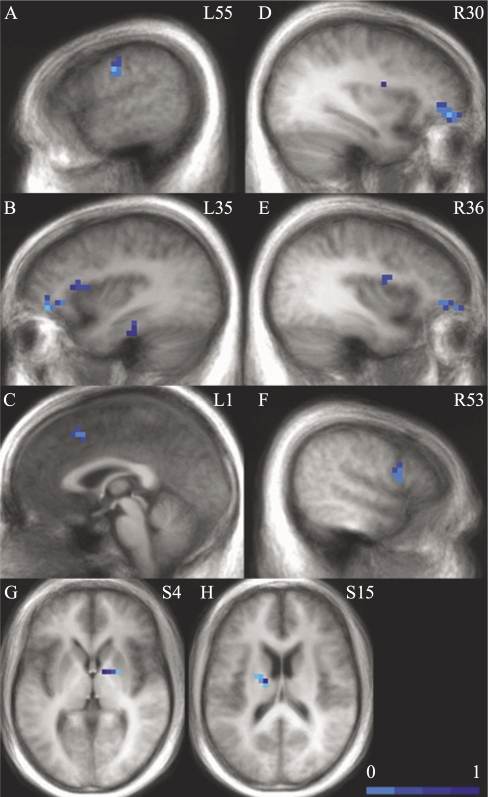
Measurements and results: Patients with OSA showed decreased brain activation in cingulate, frontal, and parietal regions typically involved in attention tasks, compared with control subjects. Within the patients with OSA, increasing arousal index, but not desaturation index, was associated with slower mean reaction time and with decreased brain activation in areas involved in arousal and attention, response selection, motor response, and decision making. The apnea-hypopnea index, by itself, was not associated with changes in cerebral response.
Conclusions: Patients with OSA showed decreased brain activation compared with control subjects during an attention task. The association of arousal index (but not hypoxia) with slow reaction times and brain activation suggests that alertness and reaction times show greater correlations with measures of sleep disruption than with measures of hypoxia.
Figures
References
-
- Malhotra A, White DP. Obstructive sleep apnoea. Lancet. 2002;360:237–45. - PubMed
-
- Young T, Peppard PE, Gottlieb DJ. Epidemiology of obstructive sleep apnea—a population health perspective. Am J Respir Crit Care Med. 2002;165:1217–39. - PubMed
-
- Placidi F, Diomedi M, Cupini LM, Bernardi G, Silvestrini M. Impairment of daytime cerebrovascular reactivity in patients with obstructive sleep apnoea syndrome. J Sleep Res. 1998;7:288–92. - PubMed
-
- Engleman HM, Kingshott RN, Martin SE, Douglas NJ. Cognitive function in the sleep apnea/hypopnea syndrome (SAHS) Sleep. 2000;23:102–8. - PubMed
-
- Beebe DW, Groesz L, Wells C, Nichols A, McGee K. The neuropsychological effects of obstructive sleep apnea: a meta- analysis of norm-referenced and case-controlled data. Sleep. 2003;26:298–307. - PubMed
