. 2009 Apr 1;122(Pt 7):1005-13.
doi: 10.1242/jcs.028175.

Three-dimensional electron microscopy reveals new details of membrane systems for Ca2+ signaling in the heart

Affiliations

Three-dimensional electron microscopy reveals new details of membrane systems for Ca2+ signaling in the heart

Takeharu Hayashi et al. J Cell Sci. .

Abstract

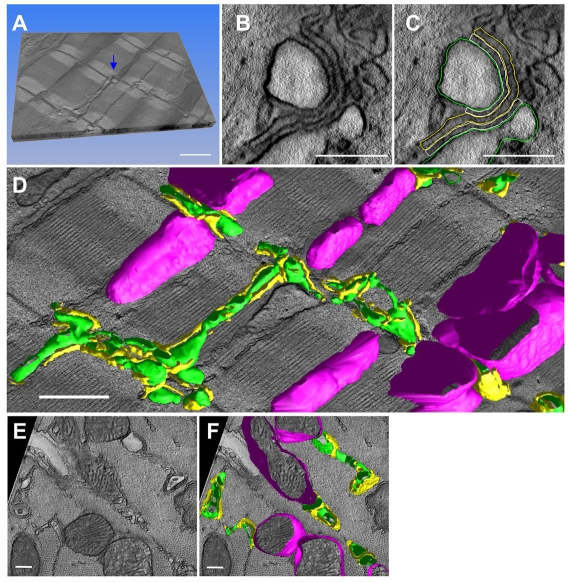
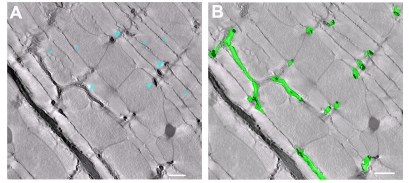
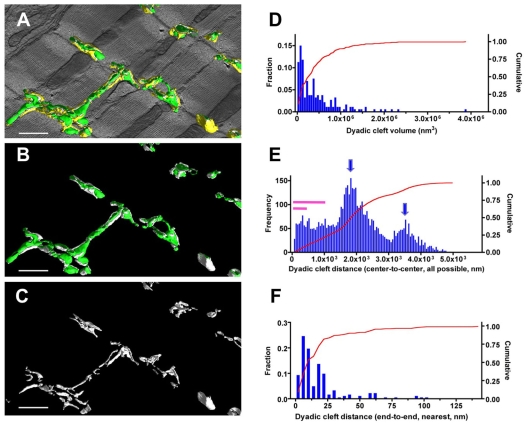
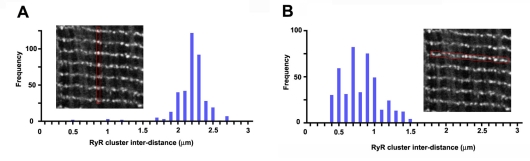
In the current study, the three-dimensional (3D) topologies of dyadic clefts and associated membrane organelles were mapped in mouse ventricular myocardium using electron tomography. The morphological details and the distribution of membrane systems, including transverse tubules (T-tubules), junctional sarcoplasmic reticulum (SR) and vicinal mitochondria, were determined and presumed to be crucial for controlling cardiac Ca(2+) dynamics. The geometric complexity of T-tubules that varied in diameter with frequent branching was clarified. Dyadic clefts were intricately shaped and remarkably small (average 4.39x10(5) nm(3), median 2.81x10(5) nm(3)). Although a dyadic cleft of average size could hold maximum 43 ryanodine receptor (RyR) tetramers, more than one-third of clefts were smaller than the size that is able to package as many as 15 RyR tetramers. The dyadic clefts were also adjacent to one another (average end-to-end distance to the nearest dyadic cleft, 19.9 nm) and were distributed irregularly along T-tubule branches. Electron-dense structures that linked membrane organelles were frequently observed between mitochondrial outer membranes and SR or T-tubules. We, thus, propose that the topology of dyadic clefts and the neighboring cellular micro-architecture are the major determinants of the local control of Ca(2+) in the heart, including the establishment of the quantal nature of SR Ca(2+) releases (e.g. Ca(2+) sparks).


Figures

Fig. 1.
Fig. 1.
3D reconstruction of cellular membrane systems in the mouse myocardium by EM tomography. (A) A stereoscopic sectional view of a volume reconstruction (size, 3.8×5.7×0.43 μm3; voxel size, 1.42 nm×1.42 nm×1.42 nm; total, 3.2 billion voxels). The upper face of the volume represents the two-dimensional (2D) image of a computed 1.42 nm slice. (B) Higher magnification view of one of the dyads in A (indicated by the arrow in A). (C) T-tubules (green), jSR (yellow) and dyadic cleft (white) were segmented as shown. The dyadic cleft is defined as a space between the opposing membranes of a jSR containing electron-dense contents (i.e. junctional granules) and a T-tubule. RyR feet are identified in the space; however, they do not always fill the cleft. The lateral border of the cleft is determined where the contours of the jSR and T-tubule membranes start to dissociate. (D) The 3D mesh models of polymorphic T-tubules (green), jSR (yellow) and mitochondria (magenta) are shown with the 2D image of a middle slice of the tomographic volume. (E) Sectional view of another volume that crosscuts most of the myofilaments. (F) The 3D mesh models of T-tubules, jSR and mitochondria in this volume. Scale bars: 1 μm in A,D; 200 nm in B,C; 500 nm in E,F.
Fig. 2.
Fig. 2.
Selectively stained T-tubules and SR in the mouse myocardium. (A) A slice image of a 3D volume reconstruction obtained from a mouse left ventricular tissue, to which a selective T-tubules/SR staining protocol was applied. T-tubules (blue arrowheads) and SR (blue asterisks) are stained with electron-opaque precipitates, have different levels of staining intensities and are mutually distinguishable. (B) T-tubules were semi-automatically segmented using IMOD, and their 3D mesh models (green) were generated. Scale bars: 500 nm.
Fig. 3.
Fig. 3.
Dyadic clefts are polymorphic, vary in size and are widely distributed in the mouse myocardium. (A-C) The 3D mesh models of dyadic clefts (white) are visualized with T-tubules (green) and jSR (yellow) in A, with only T-tubules in B, and dyadic clefts alone in C. (D) The histogram of the volumes of dyadic clefts (n=187). (E) The 50 nm step histogram of 3D center-to-center distances between dyadic clefts. Arrows indicate the oscillation pattern of the frequency distribution and purple bars represent the 0-0.3 μm and 0-1.0 μm ranges of distances. Note the frequency distribution towards the right side of the histogram is diminished owing to the size limitation of tomograms. (F) Histogram of end-to-end distances between the nearest dyadic clefts measured in 3D. Scale bars: 1 μm.
Fig. 4.
Fig. 4.
Light microscopic analysis of spatial distribution of RyR clusters in the mouse myocardium. (A,B) The nearest distance measurements of longitudinal (A, n=400) and transverse (B, n=439) spacing between immunologically stained RyR clusters, respectively. Insets are the representative staining images of RyRs in which inter-RyR cluster distances were measured (the regions of interest are outlined in red).
Fig. 5.
Fig. 5.
Spatial fluctuation of the origins of sequentially activated Ca2+ sparks in isolated adult mouse ventricular cardiomyocytes. Sequentially activated Ca2+ sparks that originated from local hot spots were visualized using line-scan confocal microscopy. Scan lines (full length, 20 μm, shown in A and E in red) were assigned along the longitudinal axis for axial recordings (A-D) and in parallel with striations for transverse scans (E-H) in isolated cardiomyocytes. (B,F) The time-dependent line scans of differential interference contrast (DIC); (C,G) The ΔF/F0 of fluo-4 fluorescence signals (fluo-4) (2 mseconds/line, recorded for 7 seconds each). The raw fluo-4 signals were background subtracted, smoothed by Gaussian filtering, and processed by the Spark Master algorithm to obtain ΔF/F0 values and to identify Ca2+ sparks (outlined). The right-hand panels in C and G are the high-magnification views of Ca2+ sparks (boxed). (D,H) Fluo-4 signal intensity profiles of respective Ca2+ sparks that were used to determine the origin of spark origins (indicated by red asterisks). The column position of each Ca2+ spark origin was identified on the scan line (white horizontal broken lines in C and G) that was assigned at the time when filtered fluo-4 signals at any pixel on the scan lines first reached 50% of the peak of the respective Ca2+ spark. The end-to-end positions of Ca2+ spark origins from each series of consecutively activated Ca2+ sparks were determined and are shown with broken red lines in D and H: their full widths are 0.55 μm (longitudinal) and 1.52 μm (transverse), respectively.
Fig. 6.
Fig. 6.
Fine anatomy of dyadic clefts in the mouse myocardium. (A) High-resolution mesh models of a T-tubule (green) and jSRs (yellow) shown with a slice image, which were constructed by dual-axis EM tomography. (B,C) The ultra-thin serial slice images of this structure revealed inhomogeneous distribution of RyR feet in dyadic cleft spaces (B) and their RyR foot-rich subdomains were segmented (light blue lines in C). (D-F) The intra-anatomy of closely assembled three dyadic clefts. From the complete mesh model (D), jSR membranes are removed to expose eight RyR foot-rich subdomains (the surface meshes of RyR-rich sub-domains are shown in light blue in E) that partially occupy dyadic cleft spaces (the whole dyadic cleft spaces are indicated as the junctional regions of T-tubule membranes, in white). Both jSR meshes and meshes that identify the RyR-rich sub-domains are removed in F. Scale bars: 200 nm.
Fig. 7.
Fig. 7.
Identification of mitochondrial membrane-associated bridge structures in the mouse cardiac myocytes. (A-C) 2D slice images obtained from a volume reconstruction of the mouse myocardium prepared by dual-axis EM tomography. Electron-dense structures that were associated with mitochondrial outer membranes (flanked by blue arrows) were identified spanning between jSR and the mitochondrial (Mito) outer membrane (A), between T-tubules (T) and mitochondria (B), and between network SR (nSR) and mitochondria (C). Mitochondrial cristae are enlarged at the sites where bridges link mitochondria to SRs and contact to the inner boundary membrane of the mitochondria (magenta arrowheads in A and C). RyR feet found in a dyadic cleft are also shown as a reference (asterisks in A). (D-H) The 3D models of mitochondria-associated bridges (blue 3D objects) together with the mesh model of membrane organelles (T-tubules, green; jSR, yellow; mitochondria, magenta). (E) The same structure as in D, viewed from a different angle. (F-H) Magnified views of outlined volumes in D,E (frames are color-coded). In E-H, mitochondrial meshes are removed to expose the bridges. (F) The 3D view of A (mitochondrion-jSR) (G) The 3D view of B (mitochondrion-T-tubule). (H) The 3D view of C (mitochondrion-nSR). Scale bars: 50 nm in A-C,F-H; 200 nm in D,E.
Fig. 8.
Fig. 8.
3D distribution of mitochondria-associated bride structures in the mouse myocardium. (A,B) 3D mesh models of mitochondrial outer membranes (magenta) and their sub-surface areas (blue) where mitochondria-associate bridge structures are populated. (C) Mesh models in a larger 3D volume (the same volume as shown in Fig. 1D and Fig. 3A-C). The mesh models of dyadic clefts (white) are displayed, together with the mitochondria-associated bridge-rich regions (blue). Narrow strips marked by blue arrows in A,B exemplify the mitochondrial associations with nSR; orange asterisks in A-C indicate regions where bridges between mitochondria and jSR are found closely to dyadic clefts. Scale bars: 1 μm.

References

    1. Bers, D. M. (2001). Excitation-Contraction Coupling and Cardiac Contractile Force. 2nd edn. Dordrecht, The Netherlands: Kluwer Academic Publishers.
    1. Bers, D. M. and Stiffel, V. M. (1993). Ratio of ryanodine to dihydropyridine receptors in cardiac and skeletal muscle and implications for E-C coupling. Am. J. Physiol. 264, C1587-C1593. - PubMed
    1. Bossen, E. H., Sommer, J. R. and Waugh, R. A. (1978). Comparative stereology of the mouse and finch left ventricle. Tissue Cell 10, 773-784. - PubMed
    1. Brette, F. and Orchard, C. (2007). Resurgence of cardiac t-tubule research. Physiology (Bethesda) 22, 167-173. - PubMed
    1. Chen-Izu, Y., McCulle, S. L., Ward, C. W., Soeller, C., Allen, B. M., Rabang, C., Cannell, M. B., Balke, C. W. and Izu, L. T. (2006). Three-dimensional distribution of ryanodine receptor clusters in cardiac myocytes. Biophys. J. 91, 1-13. - PMC - PubMed

Publication types

MeSH terms

Substances