. 2009 Apr 1;122(Pt 7):1045-53.
doi: 10.1242/jcs.041376.

Reprogramming to a muscle fate by fusion recapitulates differentiation

Affiliations

Reprogramming to a muscle fate by fusion recapitulates differentiation

Jason H Pomerantz et al. J Cell Sci. .

Abstract

Fusion of mammalian cells to form stable, non-dividing heterokaryons results in nuclear reprogramming without the exchange of genetic material. In this report, we show that reprogramming in somatic cell heterokaryons involves activation of the canonical skeletal muscle transcription factors as well as contraction-excitation genes. Thus, the effect of heterokaryon formation on gene expression is to induce a recapitulation of differentiation. Heterokaryons formed with a relatively refractory cell type, the hepatocyte cell line HepG2, revealed the importance of both MyoD expression and other unidentified cytoplasmic components, neither of which are sufficient for efficient muscle gene activation, but are synergistic. We provide evidence that de-repression by transient histone deacetylase inhibition can induce MyoD expression and increase the extent and efficiency of muscle gene transcription. Taken together, the results suggest that understanding the mechanistic basis, using a combination of approaches, and taking into account cell history, will facilitate an increase in the efficiency and fidelity of conversion from one differentiated phenotype to another desired cell type. Inherent advantages of the heterokaryon system merit further investigation in the pursuit of directed cloning.


Figures
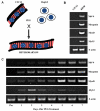
Fig. 1.
Fig. 1.
Reprogramming of gene expression in heterokaryons formed between differentiating murine myoblasts and human hepatoma cells (HepG2). (A) HepG2 cells were fused with myotubes using polyethylene glycol, and resulting cultures were grown in differentiation medium supplemented with ara-c and ouabain. (B) Activation of muscle gene expression over time after fusion. RT-PCR using human-specific primers for genes encoding Myf-5, MyoD, myogenin and Mrf-4. Controls for primer specificity and absence of amplification in mouse muscle cells (C2C12, murine myoblasts; Rh30, human rhabdomyosarcoma cell line). (C) Time course of gene expression by hepatocyte nuclei before and at daily time points after fusion (β-actin, 30 cycles; Myf-5, 33 cycles; MyoD, 35 cycles; myogenin, 33 cycles; Mrf-4, 33 cycles).
Fig. 2.
Fig. 2.
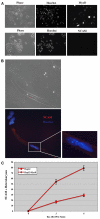
Effects of overexpression of MyoD in HepG2 cells. (A) Morphology of HepG2-MyoD cells (Phase). HepG2-MyoD cells stained with anti-MyoD antibody and Alexa Fluor 488 anti-mouse secondary antibody show stable expression of MyoD (top row, MyoD). Cells stained with anti-NCAM antibody 5.1H11 and Alexa Fluor 488 secondary antibody as in heterokaryon experiments are shown in bottom row (NCAM). (B) Activation of NCAM protein expression in HepG2 or HepG2-MyoD nuclei after fusion with muscle cells. Skeletal muscle NCAM is expressed by hepatocyte nuclei only after fusion with muscle cells (NCAM, red). Individual cells are determined to be heterokaryons by the presence of nuclei derived from both human (uniform staining pattern) and mouse (punctate staining pattern) nuclei. (C) Frequency of muscle gene activation scored as the percentage of individual heterokaryons that express human NCAM (NCAM + heterokaryons). Error bars indicate the standard error of the proportion calculated from the binomial equation.
Fig. 3.
Fig. 3.
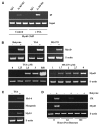
De-repression of myogenic bHLH transcription factors by histone acetylation. (A) Chromatin immunoprecipitation was performed using HepG2 cells in the presence (24 hours) or absence of trichostatin-A (2.5 μM; TSA) with control antibody (IgG), acetylated histone antibody (Ac K9 H3) or dimethyl-histone H3 (Lys9) (unmarked lane), followed by semi-quantitative PCR amplification of the MyoD promoter from 10% of the immunoprecipitate (IP) or 2% of the input sample prior to immunoprecipitation (Input) (36 cycles). (B) Induction of MYOD1 transcription in cells treated with various histone deacetylase inhibitors. Concentrations of HDAC inhibitors used in the top three panels were: 0.5 mM sodium butyrate (Butyrate); 2.5 μM trichostatin-A (TSA); 9 μM MS-275. For demonstration of dose response, TSA or MS-275 was used at the indicated concentration (bottom panels). In all cases, HDAC inhibitors were added to cells in growth medium for 24 hours before harvesting. β-actin was detected as a loading control. The rhabdomyosarcoma cell line Rh30 was used as a positive control for MYOD1 transcription (RH). RT-PCR was performed on 500 ng RNA for 35 cycles. (C) Assay for induction of the four canonical myogenic bHLH transcription factors in HepG2 cells after exposure to TSA. Cells were exposed to 2.5 μM TSA for 24 hours followed by RT-PCR for the indicated transcripts (Myf-5, 33 cycles; MyoD, 35 cycles; Mrf-4, 34 cycles; myogenin, 34 cycles; β-actin, 30 cycles). (D) Return to baseline gene expression after withdrawal of histone deacetylase inhibitor. HepG2 cells were treated with sodium butyrate (5 mM) for 24 hours followed by a medium change. RT-PCR for MyoD and creatine kinase (CK) was performed on cells harvested after 24 hours of butyrate exposure or at the indicated time points after washout (39 cycles). β-actin was detected as a loading control (30 cycles).
Fig. 4.
Fig. 4.
Effects of HDAC inhibition on muscle gene activation in heterokaryons. Where indicated by (+), cells were treated with HDAC inhibitors for 24 hours, then washed, trypsinized and seeded for heterokaryon formation. Untreated controls are indicated by (–). (A) HepG2 cells were exposed to three different pharmacological HDAC inhibitors: 0.5 mM sodium butyrate (But), 2.5 μM Trichostatin-A (TSA) and 3.3 μM MS-275 (MS). (B) Specific inhibition of HDAC1 was tested by infecting HepG2 cells with a retrovirus expressing shRNAs targeting HDAC1 or control shRNA, followed by brief selection in puromycin and heterokaryon formation. Knockdown of HDAC1 was confirmed by RT-PCR [23 cycles for both HDAC1 (inset, top row) and β-actin (inset, bottom row)]; the control sample is on the left and the HDAC shRNA sample on the right. (C) HepG2-MyoD cells were either untreated or treated with 0.5 mM sodium butyrate, followed by heterokaryon formation and assay for NCAM expression. NCAM expression was assayed at day 3 and day 6 after fusion. In all cases, reprogramming was scored as the percentage of heterokaryons with positive staining for human NCAM, using the antibody 5.1H11. Error bars indicate the standard error of the proportion calculated from the binomial equation. Experiments were performed at least in triplicate.
Fig. 5.
Fig. 5.
Effect of HDAC inhibition on muscle gene expression in primary human keratinocytes. (A) Cells were exposed to TSA for 24 hours and then used to form heterokaryons as in the previous figure. Equal numbers of control and treated cells were seeded. Results are means ± standard error of the proportion. (B) Induction of MYOD1 transcription after treatment with TSA.
Fig. 6.
Fig. 6.
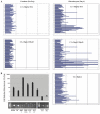
Species-specific array hybridization for activation of muscle genes in non-muscle cell nuclei (A). Data displayed in bar graph format with fold change in expression level of the sample compared with control HepG2 cells before fusion along the x-axis. A value of 1.5 indicates significant fold change (P<0.05) calculated by the non-parametric Rank Product test. For each experiment, fold change in gene expression was evaluated after seeding but before fusion (PrePeg), and at 6 days after fusion (Day 6) compared with HepG2 PrePeg as a control. (B) Quantitative RT-PCR for human muscle genes. Human-specific primers for eight genes encoding desmin, creatine kinase (CK), myosin heavy chain 2 (MHC2), cardiac α-actin, troponin T1, troponin C1, ID1 and ID2 were designed and normalized to the three housekeeping genes encoding GAPDH, PMS and HRPT. Each sample was run in triplicate. The data are represented on a logarithmic scale as fold induction of expression of the indicated gene in heterokaryons compared with before fusion (top panel). The PCR products are shown demonstrating the species specificity; in each case, use of mouse C2C12 RNA resulted in failure to amplify a product (left lanes) and use of human muscle RNA resulted in amplification of a single band of the appropriate size (right lanes).

References

    1. Aoi, T., Yae, K., Nakagawa, M., Ichisaka, T., Okita, K., Takahashi, K., Chiba, T. and Yamanaka, S. (2008). Generation of pluripotent stem cells from adult mouse liver and stomach cells. Science 321, 699-702. - PubMed
    1. Blakely, B. T. (1993). Negative and positive regulatory mechanisms in muscle and liver differentiation. PhD Thesis, Stanford University, Palo Alto, CA, USA.
    1. Blau, H. M., Chiu, C. P. and Webster, C. (1983). Cytoplasmic activation of human nuclear genes in stable heterocaryons. Cell 32, 1171-1180. - PubMed
    1. Blau, H. M., Chiu, C. P., Pavlath, G. K. and Webster, C. (1985a). Muscle gene expression in heterokaryons. Adv. Exp. Med. Biol. 182, 231-247. - PubMed
    1. Blau, H. M., Pavlath, G. K., Hardeman, E. C., Chiu, C. P., Silberstein, L., Webster, S. G., Miller, S. C. and Webster, C. (1985b). Plasticity of the differentiated state. Science 230, 758-766. - PubMed

Publication types

MeSH terms