Specific loss of brain ABCA1 increases brain cholesterol uptake and influences neuronal structure and function
- PMID: 19295162
- PMCID: PMC2678874
- DOI: 10.1523/JNEUROSCI.4741-08.2009
Specific loss of brain ABCA1 increases brain cholesterol uptake and influences neuronal structure and function
Abstract
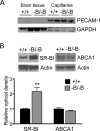
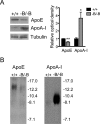
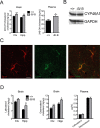
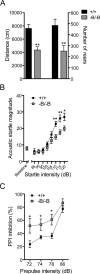
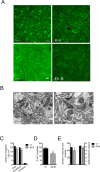
The expression of the cholesterol transporter ATP-binding cassette transporter A1 (ABCA1) in the brain and its role in the lipidation of apolipoproteins indicate that ABCA1 may play a critical role in brain cholesterol metabolism. To investigate the role of ABCA1 in brain cholesterol homeostasis and trafficking, we characterized mice that specifically lacked ABCA1 in the CNS, generated using the Cre/loxP recombination system. These mice showed reduced plasma high-density lipoprotein (HDL) cholesterol levels associated with decreased brain cholesterol content and enhanced brain uptake of esterified cholesterol from plasma HDL. Increased levels of HDL receptor SR-BI in brain capillaries and apolipoprotein A-I in brain and CSF of mutant mice were evident. Cholesterol homeostasis changes were mirrored by disturbances in motor activity and sensorimotor function. Changes in synaptic ultrastructure including reduced synapse and synaptic vesicle numbers were observed. These data show that ABCA1 is a key regulator of brain cholesterol metabolism and that disturbances in cholesterol transport in the CNS are associated with structural and functional deficits in neurons. Moreover, our findings also demonstrate that specific changes in brain cholesterol metabolism can lead to alterations in cholesterol uptake from plasma to brain.
Figures


Similar articles
-
Adipose tissue ATP binding cassette transporter A1 contributes to high-density lipoprotein biogenesis in vivo.Circulation. 2011 Oct 11;124(15):1663-72. doi: 10.1161/CIRCULATIONAHA.111.025445. Epub 2011 Sep 19. Circulation. 2011. PMID: 21931081 Free PMC article.
-
Adipocyte modulation of high-density lipoprotein cholesterol.Circulation. 2010 Mar 23;121(11):1347-55. doi: 10.1161/CIRCULATIONAHA.109.897330. Epub 2010 Mar 8. Circulation. 2010. PMID: 20212278 Free PMC article.
-
The ATP binding cassette transporter A1 (ABCA1) modulates the development of aortic atherosclerosis in C57BL/6 and apoE-knockout mice.Proc Natl Acad Sci U S A. 2002 Jan 8;99(1):407-12. doi: 10.1073/pnas.012587699. Epub 2001 Dec 18. Proc Natl Acad Sci U S A. 2002. PMID: 11752403 Free PMC article.
-
Scavenger receptor BI and ATP-binding cassette transporter A1 in reverse cholesterol transport and atherosclerosis.Curr Opin Lipidol. 2005 Jun;16(3):307-15. doi: 10.1097/01.mol.0000169351.28019.04. Curr Opin Lipidol. 2005. PMID: 15891392 Review.
-
ATP-binding cassette transporters A1 and G1, HDL metabolism, cholesterol efflux, and inflammation: important targets for the treatment of atherosclerosis.Curr Drug Targets. 2011 May;12(5):647-60. doi: 10.2174/138945011795378522. Curr Drug Targets. 2011. PMID: 21039336 Review.
Cited by
-
Lipid Transport and Metabolism at the Blood-Brain Interface: Implications in Health and Disease.Front Physiol. 2021 Mar 30;12:645646. doi: 10.3389/fphys.2021.645646. eCollection 2021. Front Physiol. 2021. PMID: 33868013 Free PMC article. Review.
-
Central Nervous System Demyelination and Remyelination is Independent from Systemic Cholesterol Level in Theiler's Murine Encephalomyelitis.Brain Pathol. 2016 Jan;26(1):102-19. doi: 10.1111/bpa.12266. Epub 2015 Jun 10. Brain Pathol. 2016. PMID: 25959295 Free PMC article.
-
Lipid metabolism in myelinating glial cells: lessons from human inherited disorders and mouse models.J Lipid Res. 2011 Mar;52(3):419-34. doi: 10.1194/jlr.R009761. Epub 2010 Nov 9. J Lipid Res. 2011. PMID: 21062955 Free PMC article. Review.
-
Cholesterol defect is marked across multiple rodent models of Huntington's disease and is manifest in astrocytes.J Neurosci. 2010 Aug 11;30(32):10844-50. doi: 10.1523/JNEUROSCI.0917-10.2010. J Neurosci. 2010. PMID: 20702713 Free PMC article.
-
Post-Stroke Administration of L-4F Promotes Neurovascular and White Matter Remodeling in Type-2 Diabetic Stroke Mice.Front Neurol. 2022 Apr 28;13:863934. doi: 10.3389/fneur.2022.863934. eCollection 2022. Front Neurol. 2022. PMID: 35572941 Free PMC article.
References
-
- Acton S, Rigotti A, Landschulz KT, Xu S, Hobbs HH, Krieger M. Identification of scavenger receptor SR-BI as a high density lipoprotein receptor. Science. 1996;271:518–520. - PubMed
-
- Barres BA, Smith SJ. Neurobiology. Cholesterol—making or breaking the synapse. Science. 2001;294:1296–1297. - PubMed
-
- Berge KE. Sitosterolemia: a gateway to new knowledge about cholesterol metabolism. Ann Med. 2003;35:502–511. - PubMed
-
- Björkhem I, Meaney S. Brain cholesterol: long secret life behind a barrier. Arterioscler Thromb Vasc Biol. 2004;24:806–815. - PubMed
Publication types
MeSH terms
Substances
Grants and funding
LinkOut - more resources
Full Text Sources
Other Literature Sources
Medical
Molecular Biology Databases
Research Materials
