The cause of the imbalance in the neuronal network leading to seizure activity can be predicted by the electrographic pattern of the seizure onset
- PMID: 19295168
- PMCID: PMC2688438
- DOI: 10.1523/JNEUROSCI.5309-08.2009
The cause of the imbalance in the neuronal network leading to seizure activity can be predicted by the electrographic pattern of the seizure onset
Abstract
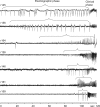
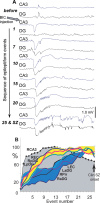
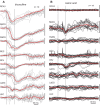
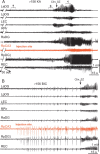
This study investigates the temporal dynamics of ictal electrical activity induced by injection of the GABA(A) receptor antagonist bicuculline, and the glutamate agonist kainic acid, into the CA3 area of hippocampus. Experiments were conducted in freely moving adult Wistar rats implanted with microelectrodes in multiple brain areas. Wide-band electrical activity (0.1-3000 Hz) was recorded, and the latency of seizure onset as well as the pattern of electrical activity were investigated for each drug. The latencies between injection and the occurrence of first epileptiform events were 3.93 +/- 2.76 (+/-STD) min for bicuculline and 6.37 +/- 7.66 min for kainic acid, suggesting the existence of powerful seizure-suppressive mechanisms in the brain. Bicuculline evoked high-amplitude rhythmic epileptiform events at the site of injection which resembled interictal EEG spikes and rapidly propagated to adjacent and remote brain areas. Kainic acid evoked a completely different pattern with a gradual increase in the amplitude of 30-80 Hz activity. Whereas there was strong temporal correlation between EEG events at the site of bicuculline injection and discharges in distant areas, much less correlation was seen with kainic acid injection. Both patterns were followed by generalized ictal EEG discharges and behavioral seizures. Our results illustrate that the same area of the brain can trigger seizures with different electrographic patterns. The knowledge of the network mechanisms underlying these two distinct electrographic patterns might be helpful in designing differential strategies for preventing seizure occurrence.
Figures


Similar articles
-
Analysis of chronic seizure onsets after intrahippocampal kainic acid injection in freely moving rats.Epilepsia. 2005 Oct;46(10):1592-8. doi: 10.1111/j.1528-1167.2005.00268.x. Epilepsia. 2005. PMID: 16190929
-
Electrophysiologic analysis of a chronic seizure model after unilateral hippocampal KA injection.Epilepsia. 1999 Sep;40(9):1210-21. doi: 10.1111/j.1528-1157.1999.tb00849.x. Epilepsia. 1999. PMID: 10487183
-
Propagation dynamics of epileptiform activity acutely induced by bicuculline in the hippocampal-parahippocampal region of the isolated Guinea pig brain.Epilepsia. 2005 Dec;46(12):1914-25. doi: 10.1111/j.1528-1167.2005.00342.x. Epilepsia. 2005. PMID: 16393157
-
Role of specific interictal and ictal EEG onset patterns.Epilepsy Behav. 2025 Mar;164:110298. doi: 10.1016/j.yebeh.2025.110298. Epub 2025 Feb 7. Epilepsy Behav. 2025. PMID: 39922077 Review.
-
Mechanisms of epileptiform synchronization in cortical neuronal networks.Curr Med Chem. 2014;21(6):653-62. doi: 10.2174/0929867320666131119151136. Curr Med Chem. 2014. PMID: 24251567 Free PMC article. Review.
Cited by
-
Seizure development in the acute intrahippocampal epileptic focus.Sci Rep. 2018 Jan 23;8(1):1423. doi: 10.1038/s41598-018-19675-6. Sci Rep. 2018. PMID: 29362494 Free PMC article.
-
Synchronization and desynchronization in epilepsy: controversies and hypotheses.J Physiol. 2013 Feb 15;591(4):787-97. doi: 10.1113/jphysiol.2012.239590. Epub 2012 Nov 26. J Physiol. 2013. PMID: 23184516 Free PMC article. Review.
-
Dynamics and conditions for inhibitory synaptic current to induce bursting and spreading depolarization in pyramidal neurons.Sci Rep. 2025 Mar 14;15(1):8886. doi: 10.1038/s41598-025-92647-9. Sci Rep. 2025. PMID: 40087410 Free PMC article.
-
Focal seizures are organized by feedback between neural activity and ion concentration changes.Elife. 2022 Aug 2;11:e68541. doi: 10.7554/eLife.68541. Elife. 2022. PMID: 35916367 Free PMC article.
-
The kainic acid model of temporal lobe epilepsy.Neurosci Biobehav Rev. 2013 Dec;37(10 Pt 2):2887-99. doi: 10.1016/j.neubiorev.2013.10.011. Epub 2013 Oct 30. Neurosci Biobehav Rev. 2013. PMID: 24184743 Free PMC article. Review.
References
-
- Akaike K, Tanaka S, Tojo H, Fukumoto S, Imamura S, Takigawa M. Kainic acid-induced dorsal and ventral hippocampal seizures in rats. Brain Res. 2001;900:65–71. - PubMed
-
- Ben-Ari Y, Tremblay E, Riche D, Ghilini G, Naquet R. Electrographic, clinical and pathological alterations following systemic administration of kainic acid, bicuculline or pentetrazole: metabolic mapping using the deoxyglucose method with special reference to the pathology of epilepsy. Neuroscience. 1981;6:1361–1391. - PubMed
-
- Bragin A, Jandó G, Nádasdy Z, van Landeghem M, Buzsáki G. Dentate EEG spikes and associated interneuronal population bursts in the hippocampal hilar region of the rat. J Neurophysiol. 1995;73:1691–1705. - PubMed
-
- Bragin A, Engel J, Jr, Wilson CL, Vizentin E, Mathern GW. Electrophysiologic analysis of a chronic seizure model after unilateral hippocampal KA injection. Epilepsia. 1999;40:1210–1221. - PubMed
Publication types
MeSH terms
Grants and funding
LinkOut - more resources
Full Text Sources
Medical
Research Materials
Miscellaneous
