Viral load and CD4+ T-cell dynamics in primary HIV-1 subtype C infection
- PMID: 19295336
- PMCID: PMC2701379
- DOI: 10.1097/QAI.0b013e3181900141
Viral load and CD4+ T-cell dynamics in primary HIV-1 subtype C infection
Abstract
Background: Most knowledge of primary HIV-1 infection is based on subtype B studies, whereas the evolution of viral parameters in the early phase of HIV-1 subtype C infection is not well characterized.
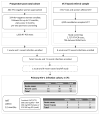
Methods: The kinetics of viral RNA, proviral DNA, CD4+ T-cell count, and subsets of CD4+ T cells expressing CCR5 or CXCR4 were characterized in 8 acute and 62 recent subtype C infections over the first year postseroconversion.
Results: The viral RNA peak was 6.25 +/- 0.92 log10 copies per milliliter. After seroconversion, heterogeneity among acute cases was evident by patterns of change in viral load and CD4+ T-cell count over time. The patterns were supported by the rate of viral RNA decline from peak (P = 0.022), viral RNA means (P = 0.005), CD4 levels (P < 0.001), and CD4 decline to 350 (P = 0.011) or 200 (P = 0.046). Proviral DNA had no apparent peak and its mean was 2.59 +/- 0.69 log10 per 106 peripheral blood mononuclear cell. In recent infections, viral RNA set point was 4.00 +/- 0.97 log10 and viral RNA correlated inversely with CD4+ T cells (P < 0.001) and directly with proviral DNA (P < 0.001).
Conclusions: Distinct patterns of viral RNA evolution may exist shortly after seroconversion in HIV-1 subtype C infection. The study provides better understanding of the early phase of subtype C infection.
Figures


Similar articles
-
Impact of HIV-1 CRF55_01B infection on the evolution of CD4 count and plasma HIV RNA load in men who have sex with men prior to antiretroviral therapy.Retrovirology. 2021 Aug 16;18(1):22. doi: 10.1186/s12977-021-00567-z. Retrovirology. 2021. PMID: 34399785 Free PMC article.
-
Viral dynamics and CD4+ T cell counts in subtype C human immunodeficiency virus type 1-infected individuals from southern Africa.AIDS Res Hum Retroviruses. 2005 Apr;21(4):285-91. doi: 10.1089/aid.2005.21.285. AIDS Res Hum Retroviruses. 2005. PMID: 15943570
-
Impact of HIV-1 subtype on CD4 count at HIV seroconversion, rate of decline, and viral load set point in European seroconverter cohorts.Clin Infect Dis. 2013 Mar;56(6):888-97. doi: 10.1093/cid/cis1000. Epub 2012 Dec 7. Clin Infect Dis. 2013. PMID: 23223594
-
Estimation of the predictive role of plasma viral load on CD4 decline in HIV-1 subtype C-infected subjects in India.J Acquir Immune Defic Syndr. 2009 Feb 1;50(2):119-25. doi: 10.1097/QAI.0b013e3181911991. J Acquir Immune Defic Syndr. 2009. PMID: 19131898 Free PMC article.
-
[Deep lung--cellular reaction to HIV].Rev Port Pneumol. 2007 Mar-Apr;13(2):175-212. Rev Port Pneumol. 2007. PMID: 17492233 Review. Portuguese.
Cited by
-
Monkeying around with HIV vaccines: using rhesus macaques to define 'gatekeepers' for clinical trials.Nat Rev Immunol. 2009 Oct;9(10):717-28. doi: 10.1038/nri2636. Nat Rev Immunol. 2009. PMID: 19859066 Free PMC article. Review.
-
A Generalized Entropy Measure of Within-Host Viral Diversity for Identifying Recent HIV-1 Infections.Medicine (Baltimore). 2015 Oct;94(42):e1865. doi: 10.1097/MD.0000000000001865. Medicine (Baltimore). 2015. PMID: 26496342 Free PMC article.
-
Evolutionary gamut of in vivo Gag substitutions during early HIV-1 subtype C infection.Virology. 2011 Dec 20;421(2):119-28. doi: 10.1016/j.virol.2011.09.020. Epub 2011 Oct 19. Virology. 2011. PMID: 22014506 Free PMC article.
-
Genome-wide association study reveals genetic variants associated with HIV-1C infection in a Botswana study population.Proc Natl Acad Sci U S A. 2021 Nov 23;118(47):e2107830118. doi: 10.1073/pnas.2107830118. Proc Natl Acad Sci U S A. 2021. PMID: 34782459 Free PMC article.
-
Viral diversity and diversification of major non-structural genes vif, vpr, vpu, tat exon 1 and rev exon 1 during primary HIV-1 subtype C infection.PLoS One. 2012;7(5):e35491. doi: 10.1371/journal.pone.0035491. Epub 2012 May 9. PLoS One. 2012. PMID: 22590503 Free PMC article. Clinical Trial.
References
-
- Osmanov S, Pattou C, Walker N, et al. Estimated global distribution and regional spread of HIV-1 genetic subtypes in the year 2000. J Acquir Immune Defic Syndr Hum Retrovirol. 2002;29:184–190. - PubMed
-
- Hemelaar J, Gouws E, Ghys PD, et al. Global and regional distribution of HIV-1 genetic subtypes and recombinants in 2004. AIDS. 2006;20:W13–W23. - PubMed
-
- UNAIDS . AIDS Epidemic Update: December 2005. Geneva, Switzerland: UNAIDS; 2005. [Accessed November 7, 2008]. Available at: http://www.unaids.org/epi/2005/doc/report_pdf.asp.
-
- UNAIDS. Report on the Global AIDS Epidemic 2006. Geneva, Switzerland: UNAIDS; 2006. [Accessed November 7, 2008]. Available at: http://www.unaids.org/en/HIV_data/2006GlobalReport/default.asp.
-
- UNAIDS. AIDS Epidemic Update 2007. Geneva, Switzerland: UNAIDS; 2007. [Accessed November 7, 2008]. Available at: http://www.unaids.org/en/KnowledgeCentre/HIVData/EpiUpdate/EpiUpdArchive...
Publication types
MeSH terms
Substances
Grants and funding
LinkOut - more resources
Full Text Sources
Medical
Research Materials

