

Are we optimizing gestational diabetes treatment with glyburide? The pharmacologic basis for better clinical practice
- PMID: 19295505
- PMCID: PMC2684566
- DOI: 10.1038/clpt.2009.5
Are we optimizing gestational diabetes treatment with glyburide? The pharmacologic basis for better clinical practice
Abstract
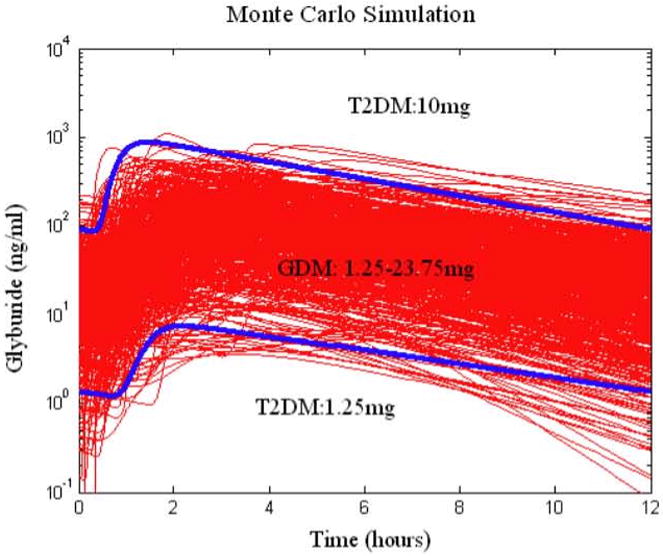
Glyburide's pharmacokinetics (PK) and pharmacodynamics have not been studied in women with gestational diabetes mellitus (GDM). The objective of this study was to assess steady-state PK of glyburide, as well as insulin sensitivity, beta-cell responsivity, and overall disposition indices after a mixed-meal tolerance test (MMTT) in women with GDM (n = 40), nonpregnant women with type 2 diabetes mellitus (T2DM) (n = 26), and healthy pregnant women (n = 40, MMTT only). At equivalent doses, glyburide plasma concentrations were approximately 50% lower in pregnant women than in nonpregnant subjects. The average umbilical cord/maternal plasma glyburide concentration ratio at the time of delivery was 0.7 +/- 0.4. Insulin sensitivity was approximately fivefold lower in women with GDM as compared with healthy pregnant women. Despite comparable beta-cell responsivity indices, the average beta-cell function corrected for insulin resistance was more than 3.5-fold lower in women with glyburide-treated GDM than in healthy pregnant women. Women with GDM in whom glyburide treatment has failed may benefit from alternative medication or dosage escalation; however, fetal safety should be kept in mind.
Figures


References
-
- Langer O, Conway DL, Berkus MD, Xenakis EMJ, Gonzales O. A comparison of glyburide and insulin in women with gestational diabetes mellitus. N Engl J Med. 2000;343:1134–1138. - PubMed
-
- Elliot BD, et al. Comparative placental transfer of oral hypoglycemic agents in humans: a model of human placental drug transfer. Am J Obstet Gynecol. 1994;171:653–660. - PubMed
-
- Niemi M, Cascorbi I, Timm R, Kroemer HK, Neuvonen PJ, Kivisto KT. Glyburide and glimepiride pharmacokinetics in subjects with different CYP2C9 genotypes. Clin Pharmacol Ther. 2002;72:326–332. - PubMed
-
- Groop LC, et al. Comparison of pharmacokinetics, metabolic effects and mechanisms of action of glyburide and glipizide during long-term treatment. Diabetes Care. 1987;10:671–678. - PubMed
-
- Jacobson GF, Ramos GA, Ching JY, Kirby RS, Ferra A, Field DR. Comparison of glyburide and insulin for the management of gestational diabetes in a large managed care organization. Am J Obstet Gynecol. 2005;193:118–124. - PubMed
Publication types
MeSH terms
Substances
Grants and funding
- UL1 TR000005/TR/NCATS NIH HHS/United States
- U10HD047891/HD/NICHD NIH HHS/United States
- U10 HD047905/HD/NICHD NIH HHS/United States
- U10HD047892/HD/NICHD NIH HHS/United States
- U10 HD047890/HD/NICHD NIH HHS/United States
- P41EB001975/EB/NIBIB NIH HHS/United States
- UL1 RR025014/RR/NCRR NIH HHS/United States
- U10HD047905/HD/NICHD NIH HHS/United States
- M01 RR023942/RR/NCRR NIH HHS/United States
- M01RR023942/RR/NCRR NIH HHS/United States
- UL1 TR000423/TR/NCATS NIH HHS/United States
- U10 HD047892/HD/NICHD NIH HHS/United States
- M01 RR020359/RR/NCRR NIH HHS/United States
- U10HD047890/HD/NICHD NIH HHS/United States
- M01RR00037/RR/NCRR NIH HHS/United States
- M01 RR000037/RR/NCRR NIH HHS/United States
- P41 EB001975/EB/NIBIB NIH HHS/United States
- U10 HD047891/HD/NICHD NIH HHS/United States
- UL1RR025014/RR/NCRR NIH HHS/United States
LinkOut - more resources
Full Text Sources
Medical
