. 2009 May 7;459(7243):108-12.
doi: 10.1038/nature07829. Epub 2009 Mar 18.

Histone modifications at human enhancers reflect global cell-type-specific gene expression

Affiliations

Histone modifications at human enhancers reflect global cell-type-specific gene expression

Nathaniel D Heintzman et al. Nature. .

Abstract

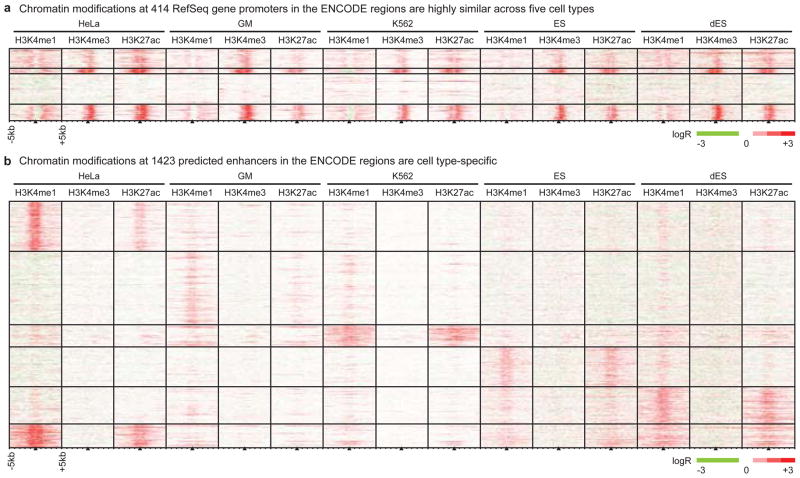
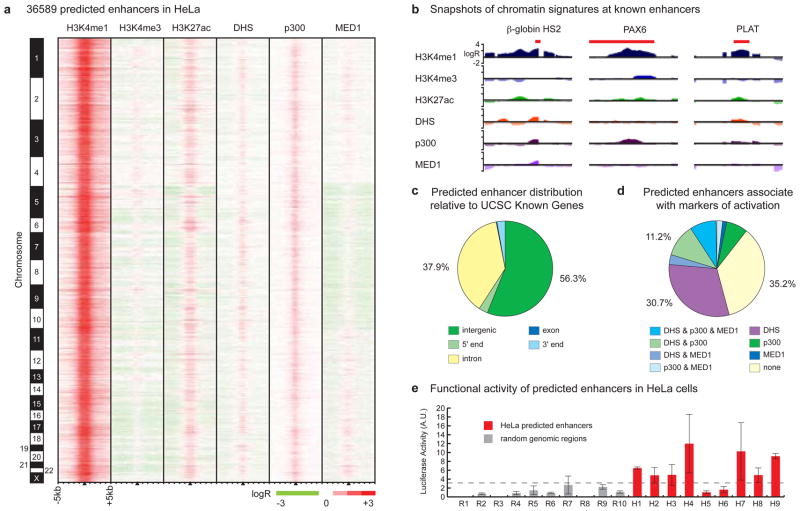
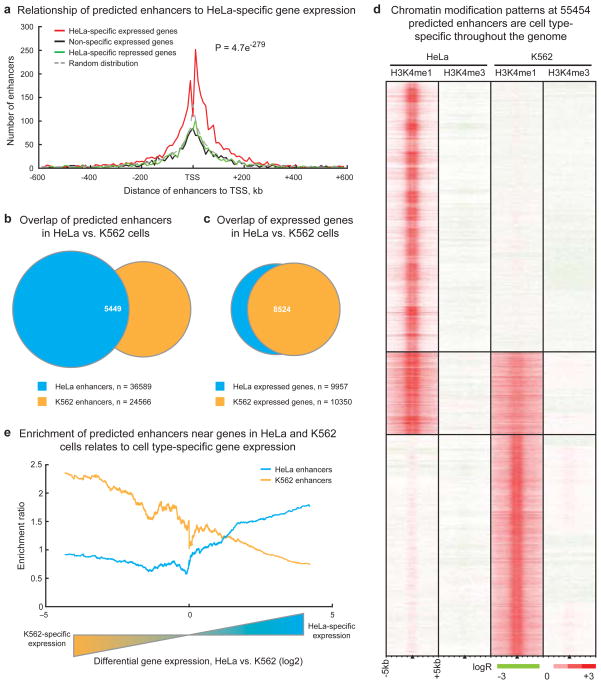
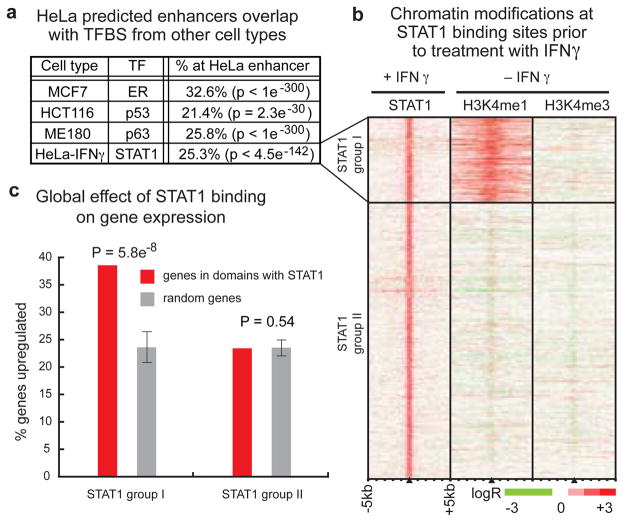
The human body is composed of diverse cell types with distinct functions. Although it is known that lineage specification depends on cell-specific gene expression, which in turn is driven by promoters, enhancers, insulators and other cis-regulatory DNA sequences for each gene, the relative roles of these regulatory elements in this process are not clear. We have previously developed a chromatin-immunoprecipitation-based microarray method (ChIP-chip) to locate promoters, enhancers and insulators in the human genome. Here we use the same approach to identify these elements in multiple cell types and investigate their roles in cell-type-specific gene expression. We observed that the chromatin state at promoters and CTCF-binding at insulators is largely invariant across diverse cell types. In contrast, enhancers are marked with highly cell-type-specific histone modification patterns, strongly correlate to cell-type-specific gene expression programs on a global scale, and are functionally active in a cell-type-specific manner. Our results define over 55,000 potential transcriptional enhancers in the human genome, significantly expanding the current catalogue of human enhancers and highlighting the role of these elements in cell-type-specific gene expression.


Figures

Figure 1
Figure 1. Chromatin modifications at promoters are cell type-invariant while those at enhancers are cell type-specific
We employed ChIP-chip to map histone modifications (H3K4me1, H3K4me3, and H3K27ac) in the ENCODE regions in five cell types (HeLa, GM, K562, ES, dES). (A) We performed k-means clustering on the chromatin modifications found +/− 5 kb from 414 promoters, and observe them to be generally invariant across cell types. (B) As in (A), but clustering on 1423 non-redundant enhancers predicted on the basis of chromatin signatures.
Figure 2
Figure 2. Genome-wide enhancer predictions in human cells
(A) We predict 36589 enhancers in HeLa cells based on chromatin signatures for H3K4me1 and H3K4me3 as determined by ChIP-chip using genome-wide tiling microarrays and condensed enhancer microarrays (see Supplementary Information). Enhancer predictions are located at the center of 10 kb windows as indicated by black triangles, and ordered by genomic position. Enrichment data are shown for histone modifications (H3K4me1, H3K4me3, and H3K27ac), DNaseI hypersensitivity (DHS), and binding of p300 and MED1. (B) ChIP-chip enrichment profiles at several known enhancers (indicated in red) recovered by prediction: β-globin HS2 (chr11:5258371-5258665), PAX6 (chr11:31630500-31635000), PLAT (chr8:42191500-42192400) (5 kb windows centered on enhancer predictions; images generated in part at the UCSC Genome Browser). (C) Most enhancers have intergenic (56.3%) or intronic (37.9%) localization relative to UCSC Known Gene 5′-ends. (D) Most enhancers (64.8%) are significantly marked by DNaseI hypersensitivity, binding of p300, binding of MED1, or some combination thereof. (E) 7 of 9 enhancers predicted in HeLa cells were active in reporter assays (red bars) as compared to none of the random fragments selected as controls (gray), where activity is defined as relative luciferase value greater than 2.33 standard deviations (p = 0.01) above the median random activity (gray dashed line). Error bars represent standard deviation. Regions of ~1–2kb in size were randomly selected for validation in reporter assays based on histone modification patterns as in (A), overlap with features in (D), and sequence features amenable to cloning via PCR (see Supplementary Information).
Figure 3
Figure 3. Chromatin modifications at enhancers are globally related to cell type-specific gene expression
(A) Enhancer localization relative to genes that are HeLa-specific expressed compared to K562, GM06990, and IMR90 cells (red), non-specific expressed (green), HeLa-specific repressed (black), and a random distribution (dashed grey). Predicted enhancers are enriched around HeLa-specific expressed genes within insulator-defined domains and depleted in domains of ubiquitous or non-expressed genes (p-value reflects significance of enhancer enrichment in domains of HeLa-specific expressed genes, see Supplementary Information). (B) Most enhancers predicted in HeLa and K562 cells are cell-type specific while (C) most genes in HeLa and K562 cells are not specifically expressed; n = integer number of enhancers or genes in each set. (D) Chromatin modification patterns are cell type-specific at the majority of 55454 enhancers predicted in HeLa and K562 cells. (E) Comparison of enhancer enrichment and differential gene expression between HeLa cells and K562 cells revealed that HeLa enhancers are enriched near HeLa-specific expressed genes (blue line) while K562 enhancers are enriched near K562-specific expressed genes (orange line).
Figure 4
Figure 4. Chromatin modifications are associated with increased regulatory response of transcription factor binding sites at enhancers
(A) Predicted enhancers in steady-state HeLa cells overlap with significant fractions of transcription factor binding sites (ER, p53, p63) in diverse cell types (MCF7, HCT116, ME180), as well as with STAT1 binding sites in HeLa cells treated with the cytokine interferon-gamma (HeLa-IFNγ) (TFBS = Transcription factor binding sites, TF = Transcription Factor). (B) Hundreds of STAT1 binding sites after treatment (+IFNγ) are marked by the enhancer chromatin signature in HeLa cells even prior to treatment (−IFNγ). (C) In HeLa cells treated with IFNγ (upper panel), gene expression is significantly (p = 5.8 × 10⁻⁸) more likely to be induced by STAT1 binding at sites with the enhancer chromatin signature (red, STAT1 group I) than by STAT1 binding at other distal sites (red, STAT1 group II) relative to a random distribution (gray). Error bars represent standard deviation.

Comment in

  • Enhancers in the spotlight.
    Pfeifer GP, Szabo PE. Pfeifer GP, et al. Epigenomics. 2009 Oct;1(1):22. Epigenomics. 2009. PMID: 22423378 No abstract available.

Similar articles

Cited by

References

    1. Heintzman ND, Ren B. The gateway to transcription: identifying, characterizing and understanding promoters in the eukaryotic genome. Cell Mol Life Sci. 2007;64:386–400. - PMC - PubMed
    1. Nightingale KP, O’Neill LP, Turner BM. Histone modifications: signalling receptors and potential elements of a heritable epigenetic code. Curr Opin Genet Dev. 2006;16:125–136. - PubMed
    1. Maston GA, Evans SK, Green MR. Transcriptional regulatory elements in the human genome. Annu Rev Genomics Hum Genet. 2006;7:29–59. - PubMed
    1. Kim TH, et al. A high-Resolution map of active promoters in the human genome. Nature. 2005;436:876–880. - PMC - PubMed
    1. Heintzman ND, et al. Distinct and predictive chromatin signatures of transcriptional promoters and enhancers in the human genome. Nat Genet. 2007;39:311–318. - PubMed

Publication types

Associated data