. 2009;4(3):e4937.
doi: 10.1371/journal.pone.0004937. Epub 2009 Mar 19.

Myostatin inhibition in muscle, but not adipose tissue, decreases fat mass and improves insulin sensitivity

Affiliations

Myostatin inhibition in muscle, but not adipose tissue, decreases fat mass and improves insulin sensitivity

Tingqing Guo et al. PLoS One. 2009.

Abstract

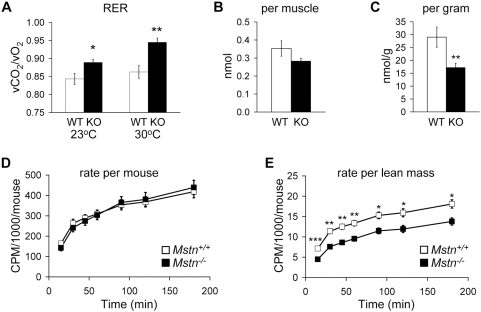
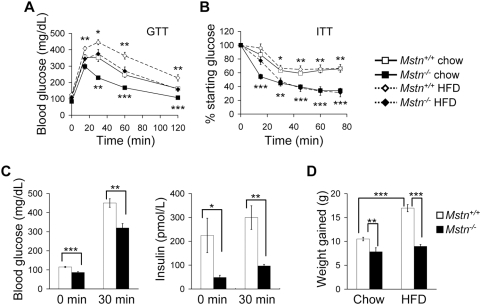
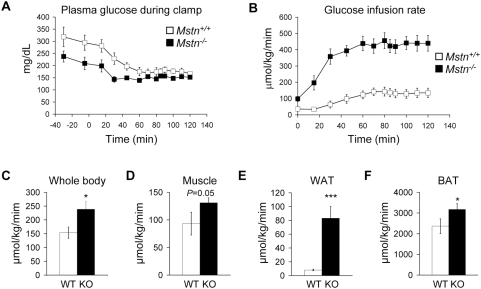
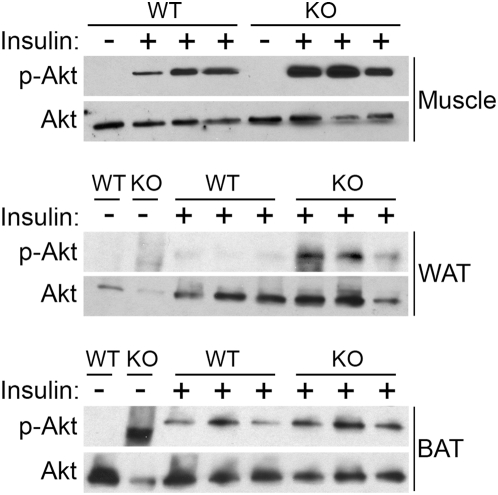
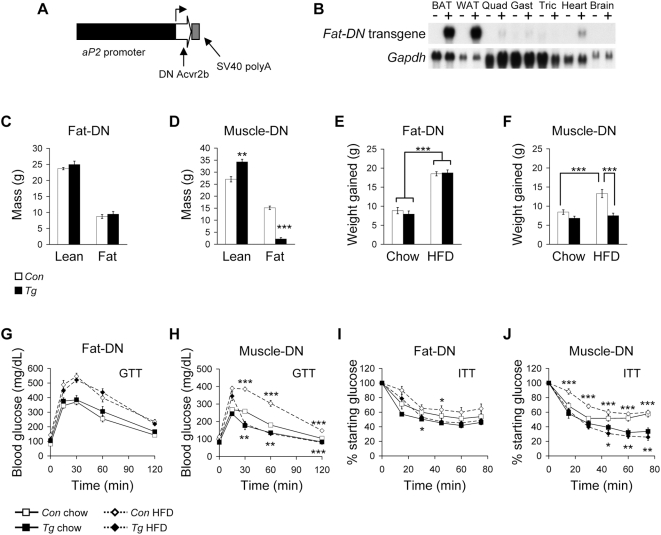
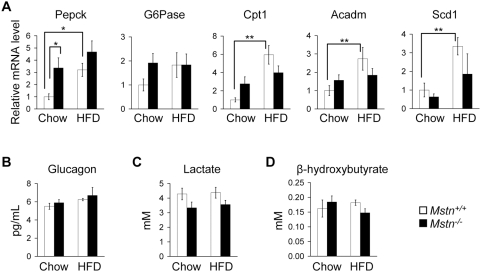
Myostatin (Mstn) is a secreted growth factor expressed in skeletal muscle and adipose tissue that negatively regulates skeletal muscle mass. Mstn(-/-) mice have a dramatic increase in muscle mass, reduction in fat mass, and resistance to diet-induced and genetic obesity. To determine how Mstn deletion causes reduced adiposity and resistance to obesity, we analyzed substrate utilization and insulin sensitivity in Mstn(-/-) mice fed a standard chow. Despite reduced lipid oxidation in skeletal muscle, Mstn(-/-) mice had no change in the rate of whole body lipid oxidation. In contrast, Mstn(-/-) mice had increased glucose utilization and insulin sensitivity as measured by indirect calorimetry, glucose and insulin tolerance tests, and hyperinsulinemic-euglycemic clamp. To determine whether these metabolic effects were due primarily to the loss of myostatin signaling in muscle or adipose tissue, we compared two transgenic mouse lines carrying a dominant negative activin IIB receptor expressed specifically in adipocytes or skeletal muscle. We found that inhibition of myostatin signaling in adipose tissue had no effect on body composition, weight gain, or glucose and insulin tolerance in mice fed a standard diet or a high-fat diet. In contrast, inhibition of myostatin signaling in skeletal muscle, like Mstn deletion, resulted in increased lean mass, decreased fat mass, improved glucose metabolism on standard and high-fat diets, and resistance to diet-induced obesity. Our results demonstrate that Mstn(-/-) mice have an increase in insulin sensitivity and glucose uptake, and that the reduction in adipose tissue mass in Mstn(-/-) mice is an indirect result of metabolic changes in skeletal muscle. These data suggest that increasing muscle mass by administration of myostatin antagonists may be a promising therapeutic target for treating patients with obesity or diabetes.


Conflict of interest statement

Competing Interests: Under a licensing agreement between MetaMorphix, Inc. (MMI) and the Johns Hopkins University, A.C.M. is entitled to a share of royalty received by the University on sales of myostatin. A.C.M. and the University own MMI stock, which is subject to certain restrictions under University policy. The terms of these arrangements are being managed by the University in accordance with its conflict of interest policies.

Figures

Figure 1
Figure 1. Substrate utilization in Mstn+/+ and Mstn−/− mice on standard chow.
(A) Total respiratory exchange ratio determined by indirect calorimetry. (B) Amount of palmitate oxidized per soleus muscle. (C) Amount of palmitate oxidized by soleus muscle normalized to soleus mass. (D) Rate of oleic acid oxidation per mouse. (E) Rate of oleic acid oxidation normalized to lean mass. n = 6–10. *P<0.05, **P<0.01, ***P<0.001.
Figure 2
Figure 2. Mstn−/− mice have increased insulin sensitivity and reduced weight gain on standard chow and HFD.
(A) Blood glucose levels during GTT of Mstn+/+ and Mstn−/− mice on standard chow or HFD. n = 8–16. (B) Percent of starting glucose during ITT of Mstn+/+ and Mstn−/− mice on standard chow or HFD. n = 6–10. (C) Blood glucose (left panel) and insulin (right panel) 0 and 30 minutes after glucose injection in fasted mice maintained on standard chow. n = 6. (D) Body weight gained by Mstn+/+ and Mstn−/− mice after 10 weeks on diets. n = 7–16. *P<0.05, **P<0.01, ***P<0.001. A and B, P value symbols are for comparisons between genotypes on the same diet; below curves, mice on standard chow; above curves, mice on HFD.
Figure 3
Figure 3. Mstn−/− mice have increased glucose uptake by hyperinsulinemic-euglycemic clamp.
(A) Plasma glucose concentration before and during clamp. Insulin was infused at time 0. (B) Glucose infusion rate during clamp. Glucose uptake in (C) whole body, (D) skeletal muscle, (E) WAT, and (F) BAT. n = 7–8. *P<0.05, ***P<0.001.
Figure 4
Figure 4. Insulin-stimulated activation of Akt by Western blot.
In vivo total Akt and phospho-Akt in gastrocnemius muscle, WAT, and BAT from Mstn+/+ and Mstn−/− mice with or without insulin stimulation. Each lane contains protein from a different animal.
Figure 5
Figure 5. Tissue-specific inhibition of myostatin signaling.
(A) Diagram of the construct used to make fat-DN transgenic mice with the aP2 promoter controlling expression of a truncated Acvr2b containing the extracellular ligand binding and transmembrane domains. (B) Northern blot analysis of expression of fat-DN transgene and Gapdh loading control from different tissues from non-transgenic (−) and transgenic (+) mice. Body composition of (C) fat-DN (n = 10–11) and (D) muscle-DN (n = 5) male mice compared to non-transgenic littermates. Lean and fat mass are shown as absolute values. Body weight gained by (E) fat-DN (n = 9–17) and (F) muscle-DN (n = 9–14) male mice and littermate controls after 10 weeks on diets. Blood glucose levels during GTT of (G) fat-DN (n = 7–8) and (H) muscle-DN (n = 9–14) male mice and littermate controls on standard chow and HFD. Percent of starting glucose during ITT of (I) fat-DN (n = 7–8) and (J) muscle-DN (n = 9–12) male mice and littermate controls on standard chow and HFD. *P<0.05, **P<0.01, ***P<0.001. G–J, P value symbols are for comparisons between genotypes on the same diet; below curves, mice on standard chow; above curves, mice on HFD.
Figure 6
Figure 6. Adaptation to increased muscle mass.
(A) Relative mRNA expression levels in liver of Pepck, G6Pase, Cpt1, Acadm, and Scd1 measured by quantitative RT-PCR in Mstn+/+ and Mstn−/− mice on standard chow or HFD. (B) Serum glucagon, (C) lactate, and (D) β-hydroxybutyrate levels in Mstn+/+ and Mstn−/− mice on standard chow and HFD. n = 6–12. *P<0.05, **P<0.01.

References

    1. Lee SJ. Regulation of muscle mass by myostatin. Annu Rev Cell Dev Biol. 2004;20:61–86. - PubMed
    1. Patel K, Amthor H. The function of Myostatin and strategies of Myostatin blockade-new hope for therapies aimed at promoting growth of skeletal muscle. Neuromuscul Disord. 2005;15:117–126. - PubMed
    1. Lee SJ. Sprinting without myostatin: a genetic determinant of athletic prowess. Trends Genet. 2007;23:475–477. - PubMed
    1. Bogdanovich S, Krag TO, Barton ER, Morris LD, Whittemore LA, et al. Functional improvement of dystrophic muscle by myostatin blockade. Nature. 2002;420:418–421. - PubMed
    1. Bogdanovich S, McNally EM, Khurana TS. Myostatin blockade improves function but not histopathology in a murine model of limb-girdle muscular dystrophy 2C. Muscle Nerve. 2008;37:308–316. - PubMed

Publication types

MeSH terms