

Cerebrospinal fluid biomarker signature in Alzheimer's disease neuroimaging initiative subjects
- PMID: 19296504
- PMCID: PMC2696350
- DOI: 10.1002/ana.21610
Cerebrospinal fluid biomarker signature in Alzheimer's disease neuroimaging initiative subjects
Abstract
Objective: Develop a cerebrospinal fluid biomarker signature for mild Alzheimer's disease (AD) in Alzheimer's Disease Neuroimaging Initiative (ADNI) subjects.
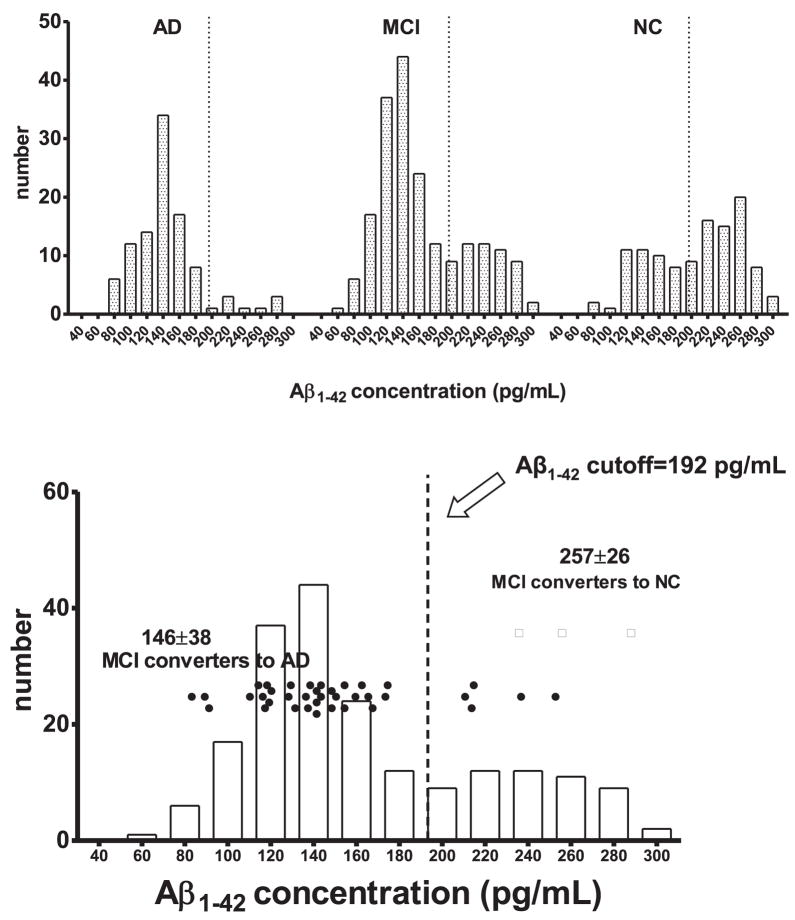
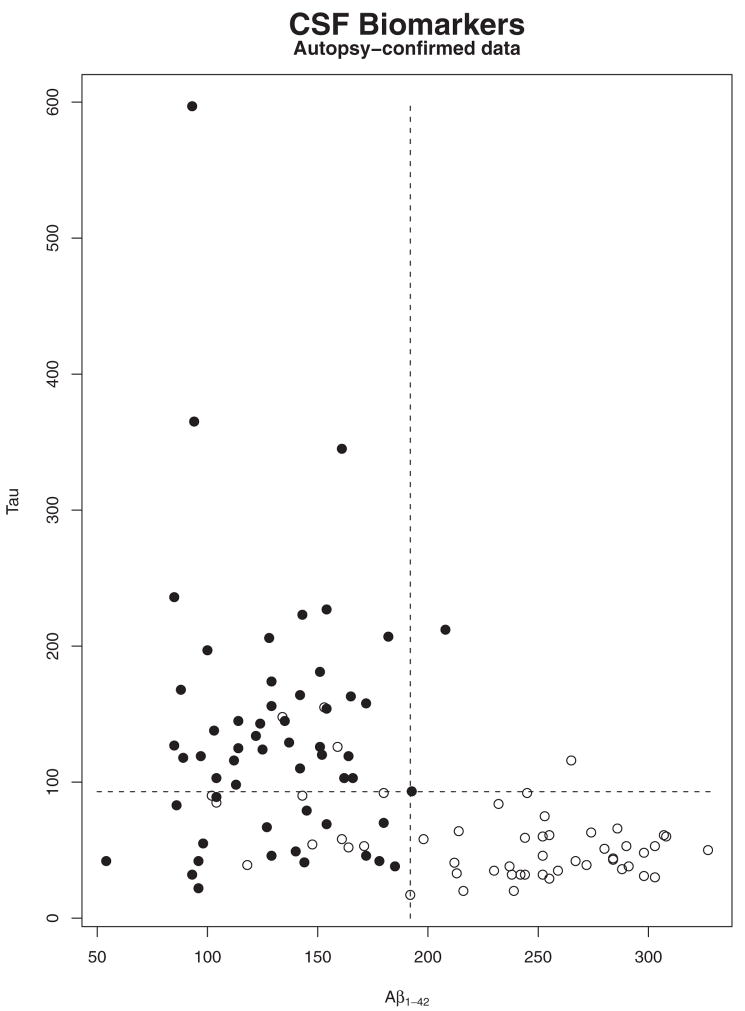
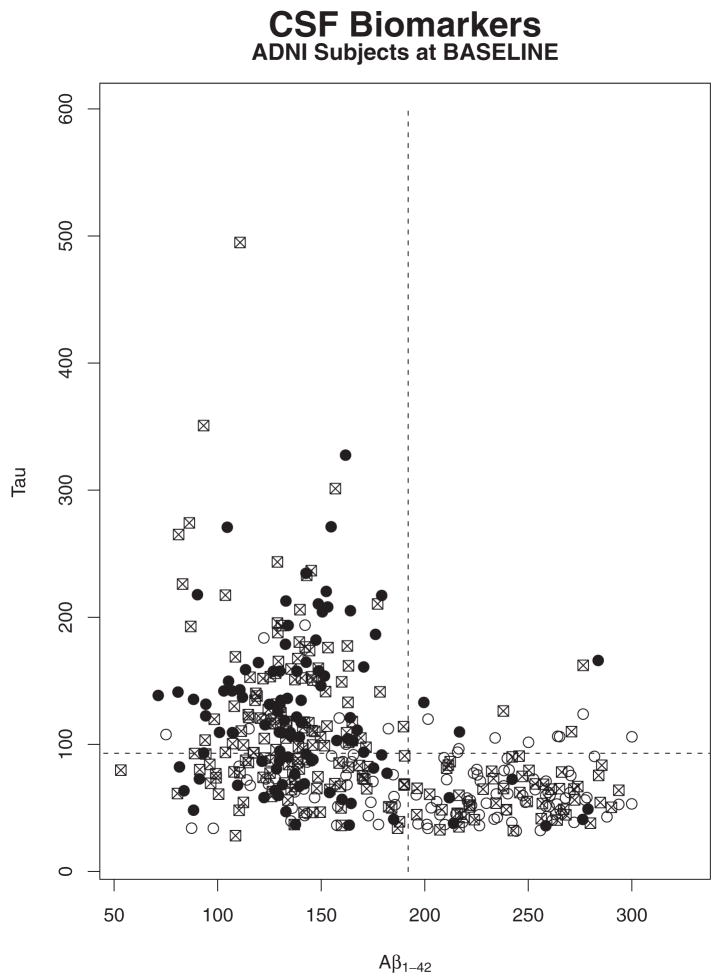
Methods: Amyloid-beta 1 to 42 peptide (A beta(1-42)), total tau (t-tau), and tau phosphorylated at the threonine 181 were measured in (1) cerebrospinal fluid (CSF) samples obtained during baseline evaluation of 100 mild AD, 196 mild cognitive impairment, and 114 elderly cognitively normal (NC) subjects in ADNI; and (2) independent 56 autopsy-confirmed AD cases and 52 age-matched elderly NCs using a multiplex immunoassay. Detection of an AD CSF profile for t-tau and A beta(1-42) in ADNI subjects was achieved using receiver operating characteristic cut points and logistic regression models derived from the autopsy-confirmed CSF data.
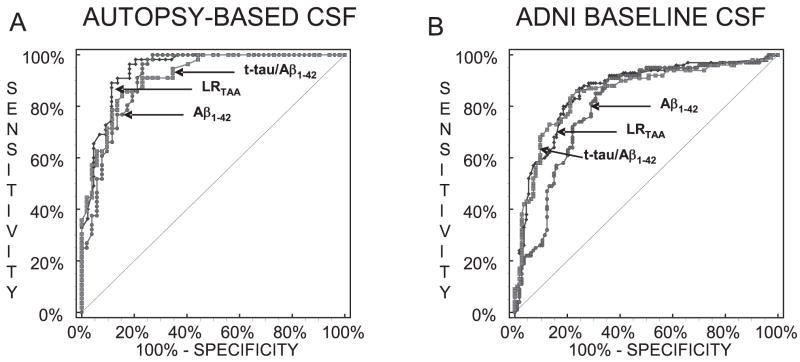
Results: CSF A beta(1-42) was the most sensitive biomarker for AD in the autopsy cohort of CSF samples: receiver operating characteristic area under the curve of 0.913 and sensitivity for AD detection of 96.4%. In the ADNI cohort, a logistic regression model for A beta(1-42), t-tau, and APO epsilon 4 allele count provided the best assessment delineation of mild AD. An AD-like baseline CSF profile for t-tau/A beta(1-42) was detected in 33 of 37 ADNI mild cognitive impairment subjects who converted to probable AD during the first year of the study.
Interpretation: The CSF biomarker signature of AD defined by A beta(1-42) and t-tau in the autopsy-confirmed AD cohort and confirmed in the cohort followed in ADNI for 12 months detects mild AD in a large, multisite, prospective clinical investigation, and this signature appears to predict conversion from mild cognitive impairment to AD.
Conflict of interest statement
Potential conflict of interest: Nothing to report.
Figures
References
-
- Forman MS, Trojanowski JQ, Lee VM-Y. Neurodegenerative diseases: a decade of discoveries paves the way for therapeutic breakthroughs. Nat Med. 2004;10:1055–1063. - PubMed
-
- Selkoe DJ. Cell biology of protein misfolding: the examples of Alzheimer’s and Parkinson’s diseases. Nat Cell Biol. 2004;6:1054–1061. - PubMed
-
- Skovronsky DM, Lee VMY, Trojanowski JQ. Neurodegenerative diseases: new concepts of pathogenesis and their therapeutic implications. Annu Rev Pathol Mech Dis. 2006;1:151–170. - PubMed
-
- Consensus report of the Working Group on: Biological Markers of Alzheimer’s Disease. The Ronald and Nancy Reagan Research Institute of the Alzheimer’s Association and the National Institute on Aging Working Group. Neurobiol Aging. 1998;19:109–116. - PubMed
Publication types
MeSH terms
Substances
Grants and funding
LinkOut - more resources
Full Text Sources
Other Literature Sources
Medical
