. 2009 Mar 17;7(3):e59.
doi: 10.1371/journal.pbio.1000059.

Oncogenic Kras initiates leukemia in hematopoietic stem cells

Affiliations

Oncogenic Kras initiates leukemia in hematopoietic stem cells

Amit J Sabnis et al. PLoS Biol. .

Abstract

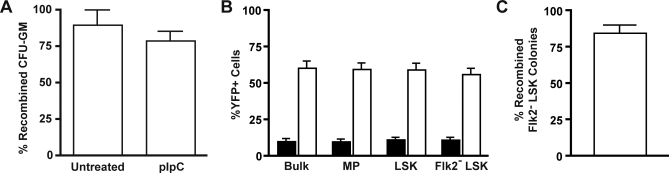
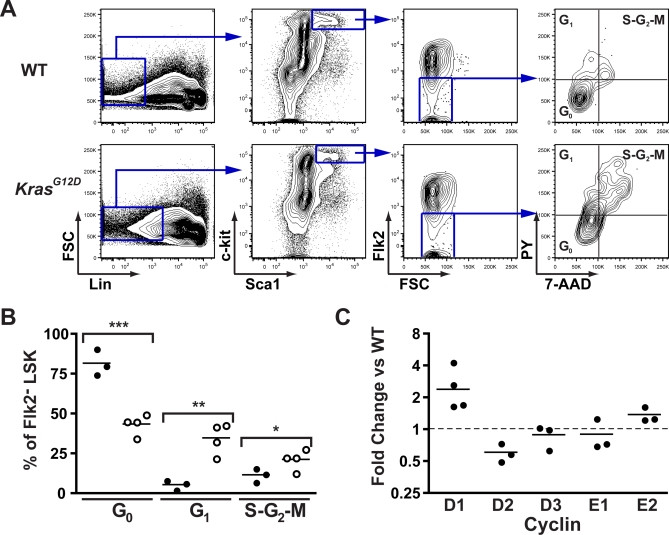
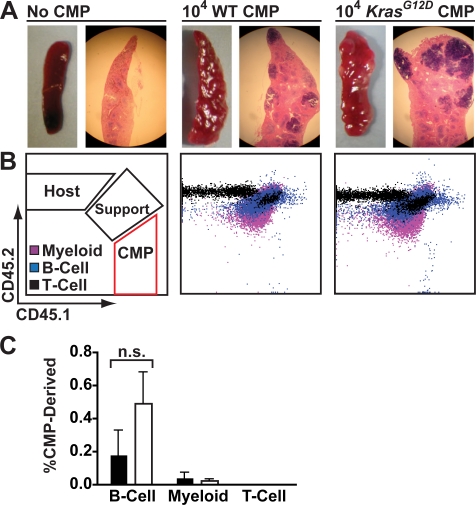
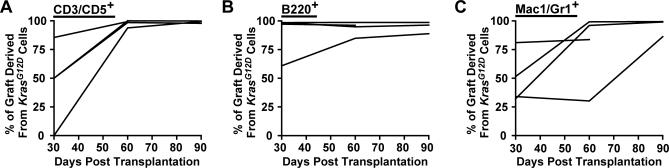
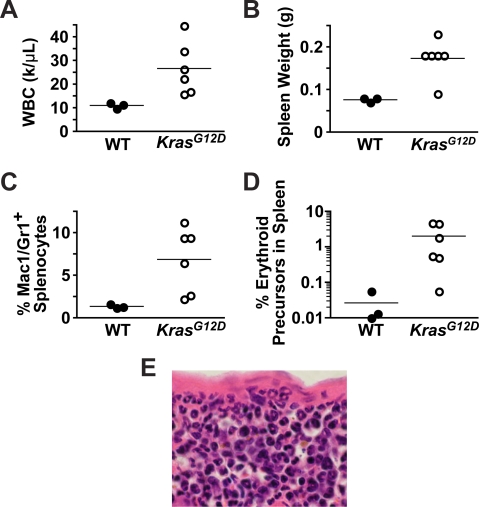
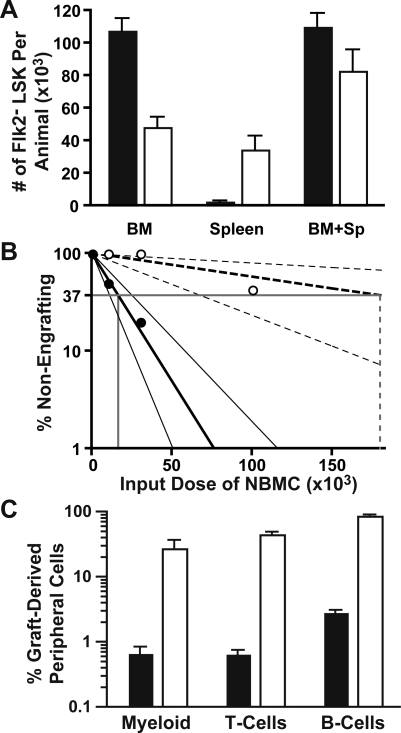
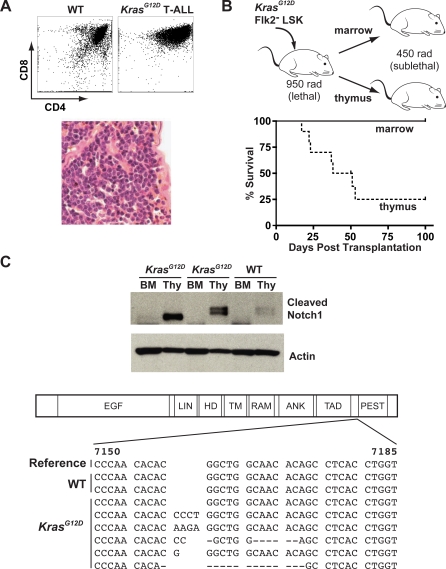
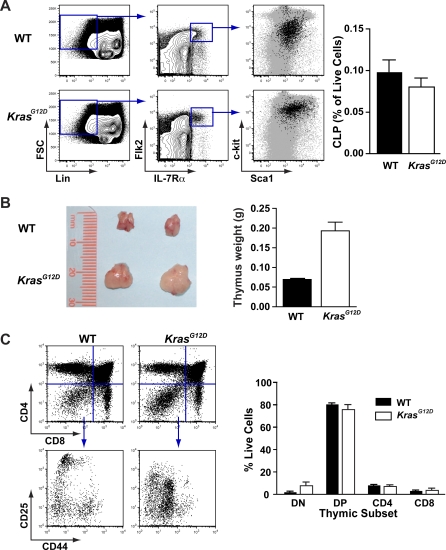
How oncogenes modulate the self-renewal properties of cancer-initiating cells is incompletely understood. Activating KRAS and NRAS mutations are among the most common oncogenic lesions detected in human cancer, and occur in myeloproliferative disorders (MPDs) and leukemias. We investigated the effects of expressing oncogenic Kras(G12D) from its endogenous locus on the proliferation and tumor-initiating properties of murine hematopoietic stem and progenitor cells. MPD could be initiated by Kras(G12D) expression in a highly restricted population enriched for hematopoietic stem cells (HSCs), but not in common myeloid progenitors. Kras(G12D) HSCs demonstrated a marked in vivo competitive advantage over wild-type cells. Kras(G12D) expression also increased the fraction of proliferating HSCs and reduced the overall size of this compartment. Transplanted Kras(G12D) HSCs efficiently initiated acute T-lineage leukemia/lymphoma, which was associated with secondary Notch1 mutations in thymocytes. We conclude that MPD-initiating activity is restricted to the HSC compartment in Kras(G12D) mice, and that distinct self-renewing populations with cooperating mutations emerge during cancer progression.


Conflict of interest statement

Competing interests. The authors have declared that no competing interests exist.

Figures

Figure 1
Figure 1. Spontaneous KrasG12D Activation in CFU-GM and HSCs from Mx1-Cre, KrasLSL-G12D Mice
(A) Bone marrow was harvested at 24 d or 5 wk of life from mice that either received a single dose of pIpC at 21 d of life or were left untreated, and plated in methylcellulose medium with GM-CSF. Individual colonies were isolated and genotyped by PCR to assess for Cre-mediated excision of the LSL cassette (n = 18 colonies from two uninjected animals, and 34 colonies from two injected animals, compiled from two independent experiments; error bars show SEM). (B) Mx1-Cre (filled bars) and Mx1-Cre, KrasLSL-G12D (open bars) mice that inherited an LSL-YFP reporter were sacrificed at 5 wk of life, without ever being injected with pIpC. Expression of YFP requires excision of the LSL cassette from the reporter gene by Cre recombinase. The percentage of YFP+ cells in all bone marrow cells (Bulk), Lin c-kit+ Sca1 myeloid progenitors (MP), LSK cells, and Flk2 LSK cells was assessed by flow cytometry. (n = 4 for WT and for Mx1-Cre, KrasLSL-G12D mice compiled from three independent experiments; error bars show SEM). (C) Flk2 LSK cells were sorted from bone marrow of 4-wk-old Mx1-Cre, KrasLSL-G12D mice that had not received pIpC, and plated in methylcellulose medium for a culture period of 14 d. Individual colonies were genotyped by PCR (n = 44 colonies from 6 mice in 3 independent experiments; error bar shows SEM).
Figure 2
Figure 2. Increased Proliferation of KrasG12D HSC
Bone marrow from 5-wk-old WT and KrasG12D mice was stained with 7-AAD and pyronin Y (PY) for DNA and RNA quantitation, along with surface markers for Flk2 LSK cells. (A) Gating is shown for cell cycle analysis of WT and KrasG12D Flk2 LSK cells. (B) Summary of replicate samples from WT (closed circles) and KrasG12D (open circles) mice (n = 3 or 4 as shown; compiled from two independent experiments). Means and SEM are WT: G0 81.8 ± 4.72, G1 5.66 ± 1.76, S-G2-M 11.7 ± 2.56; and KrasG12D: G0 43.6 ± 3.19, G1 34.9 ± 4.85, S-G2-M 21.4 ± 3.14. p-Values by unpaired t-test are indicated: ***, p < 0.001; **, p < 0.01; *, p < 0.05. (C) RNA from doubly sorted Flk2 LSK cells was isolated, and quantitative PCR performed on cDNA to test expression levels of selected cyclins (n = 3 or 4 as shown; bar shows geometric mean). Results are expressed as fold change in expression compared to WT Flk2 LSK cells, after normalization to β-actin expression. These results represent three or four independent experiments as shown, each performed with pooled bone marrow from three to five animals. The geometric mean of cyclin D1 expression is 2.4-fold over WT (95% confidence interval 1.2–4.9). Purity of sorted cells is shown in Figure S1.
Figure 3
Figure 3. KrasG12D Does Not Lead to CMP Self-Renewal
Sorted CD45.1 CMPs were transplanted into lethally irradiated CD45.2 recipients. (A) Spleens were harvested for CFU-S8 colony analysis 8 d after transplantation of 104 KrasG12D or WT CMPs. Gross images and hematoxylin/eosin stained sections are shown. (B) Peripheral blood of animals analyzed 1 mo after transplantation of 104 KrasG12D or WT CMPs along with 106 CD45.1/CD45.2 heterozygous nucleated bone marrow cells for radioprotection (Support). Costaining with surface markers allowed detection of contributions to myeloid (purple), B (blue), and T (black) lineages. (C) Percentages of CMP-derived progeny within the indicated lineages found in peripheral blood 1 mo after transplantation of WT (filled bars) or KrasG12D (open bars) CMPs (n = 4 in two independent sorts).
Figure 4
Figure 4. Transplanted KrasG12D Flk2 LSK Cells Outperform WT LSK Cells in Competitive Reconstitution
Lethally irradiated recipients (n = 4 in a single experiment) were transplanted with 500 each of KrasG12D and WT Flk2 LSK cells, then bled monthly until sacrifice. Graphs show the proportion of graft-derived cells that came from the KrasG12D donor in circulating (A) T cell (CD3/CD5+), (B) B cell (B220+), and (C) myeloid (Mac1/Gr1+) populations. This was calculated by (1) gating for graft-derived cells (CD45.1 and CD45.1/CD45.2) within a lineage, and then (2) determining the fraction of KrasG12D-derived cells (CD45.1) within this subset.
Figure 5
Figure 5. Transplanted KrasG12D Flk2 LSK Cells Induce MPD
Mice were analyzed 3 mo after transplantation with either KrasG12D or WT Flk2 LSK cells for evidence of MPD (n = 3 WT, n = 6 KrasG12D in a single experiment). (A) Numbers of circulating leukocytes (WBC). (B) Spleen weights. (C) Percentages of myeloid cells (Mac1+ and/or Gr1+) in the spleen. (D) Percentages of erythroid precursors (nucleated and TER119+) in the spleen. (E) A representative splenic section demonstrating infiltration by mature myeloid cells (ring-shaped nuclei) and erythroblasts (small dense nuclei).
Figure 6
Figure 6. HSC Number and Proliferative Capacity in KrasG12D Mice
HSCs were analyzed in KrasG12D mice or WT littermates that were treated with pIpC at 21 d of age and then sacrificed at 35 d of age. (A) Total numbers of Flk2 LSK cells in KrasG12D mice (open bars) or WT mice (filled bars) were quantified by flow cytometry in bone marrow (p < 0.001, t-test) and spleen (p < 0.01); total numbers (spleen + marrow) are also shown (p = 0.12). n = 6 mice per genotype, and error bars show SEM; data are pooled from two independent experiments. Frequencies of Flk2 LSK cells among viable nucleated cells were multiplied by nucleated bone marrow cell counts in femurs and tibias and then scaled to estimate total bone marrow numbers using published distributions [75]. (B) Whole bone marrow from KrasG12D (open circles) or WT littermates (filled circles) was tested for repopulating activity in a limit dilution transplantation assay. The calculated values for frequencies of repopulating units were 1 in 16,610 nucleated bone marrow cells (NMBC) for WT marrow and 1 in 180,404 for KrasG12D marrow. Narrow lines designate 95% confidence intervals (1:7,338 to 1:37,598 for WT and 1:68,953 to 1: 471,998 for KrasG12D; frequencies in WT versus KrasG12D marrow are significantly different with p = 0.0003 by two-tailed t-test). Outcomes of individual experiments are described in Table S1. (C) Mice that engrafted after transplantation with limiting numbers of whole bone marrow cells (1 × 10⁴ for WT, 1 × 10⁵ for KrasG12D) were bled at 2 mo to determine the percentage of circulating myeloid (Mac1/Gr1+), B-lineage (B220+), and T-lineage (CD3/CD5+) cells that were derived from the transplanted marrow. Filled bars represent mice receiving WT marrow (n = 2), open bars represent mice receiving KrasG12D marrow (n = 3; error bars show SEM; note logarithmic scale).
Figure 7
Figure 7. Transplanted KrasG12D Flk2 LSK Cells Initiate T-ALLs That Contain Notch1 Mutations
(A) Flow cytometry of thymocytes harvested from moribund recipients of KrasG12D Flk2 LSK cells shows an abnormal accumulation of CD4/CD8 double positive and immature CD8 single positive cells. Spleen histology demonstrates infiltration by monomorphic cells with open chromatin (hematoxylin/eosin). (B) Primary recipients (n = 5) received 500 KrasG12D Flk2 LSK cells with or without an equal number of WT Flk2 LSK cells after lethal irradiation (950 rad). These primary recipients were euthanized 2–3 mo later, and 106 bone marrow cells or thymocytes were transferred into sublethally irradiated (450 rad) secondary recipients (two per primary mouse). Sublethal irradiation selectively permits transfer of acute leukemia but not KrasG12D HSCs or MPD [13]. Thymocytes, but not bone marrow cells, transferred T-ALL. (C) Cell lysates from thymocytes and bone marrow of animals euthanized 3 mo after transplantation with KrasG12D or WT HSCs were blotted with an antibody specific for cleaved Notch1. Three independent primary recipients are shown. Sequence analysis demonstrates frameshift mutations near the PEST domain of Notch1 in thymocytes from five of six mice that received KrasG12D HSC, but not in recipients receiving WT HSCs alone (reference sequence from GenBank [http://www.ncbi.nlm.nih.gov/Genbank] accession number NM_008714).
Figure 8
Figure 8. Abnormal T-lymphoid Development in KrasG12D Mice
(A) Enumeration of Lin Flk2+ IL-7Rα+ c-kitint Sca1int common lymphoid progenitors (CLPs) in bone marrow of WT and KrasG12D mice. A typical comparison and gating strategy is shown, with the far right panel showing expression of c-kit and Sca1 in CLPs (black dots) compared to the larger population of Lin cells (gray dots). CLP frequencies are graphed (n = 5 WT and 6 KrasG12D; error bars show SEM and difference is not statistically significant by unpaired t-test). (B) Enlarged thymi in 7-wk-old KrasG12D mice compared with WT littermates; photograph shows a typical example, and graph shows data from a representative cohort (n = 3 mice and error bars show standard deviation; p < 0.05). (C) Flow cytometry of primary thymocytes for expression of CD4 and CD8, and also CD25 and CD44 expression within DN (CD4 CD8) cells; figure shows a representative example. Myeloid cells were excluded using Mac1 and Gr1 staining. Graph represents the frequency of thymocytes within in the live gate in DN, double positive (CD4+D8+, DP), and CD4 or CD8 single positive cells (n = 3 mice per genotype and error bars show SEM; p > 0.05 for all populations. Data are representative of three independent experiments).

Similar articles

Cited by

References

    1. Hanahan D, Weinberg RA. The hallmarks of cancer. Cell. 2000;100:57–70. - PubMed
    1. Dick JE. Acute myeloid leukemia stem cells. Ann N Y Acad Sci. 2005;1044:1–5. - PubMed
    1. Krivtsov AV, Twomey D, Feng Z, Stubbs MC, Wang Y, et al. Transformation from committed progenitor to leukaemia stem cell initiated by MLL-AF9. Nature. 2006;442:818–822. - PubMed
    1. Cozzio A, Passegue E, Ayton PM, Karsunky H, Cleary ML, et al. Similar MLL-associated leukemias arising from self-renewing stem cells and short-lived myeloid progenitors. Genes Dev. 2003;17:3029–3035. - PMC - PubMed
    1. Passegue E, Wagner EF, Weissman IL. JunB deficiency leads to a myeloproliferative disorder arising from hematopoietic stem cells. Cell. 2004;119:431–443. - PubMed

Publication types

MeSH terms

Substances