

Converging intracranial markers of conscious access
- PMID: 19296722
- PMCID: PMC2656551
- DOI: 10.1371/journal.pbio.1000061
Converging intracranial markers of conscious access
Abstract
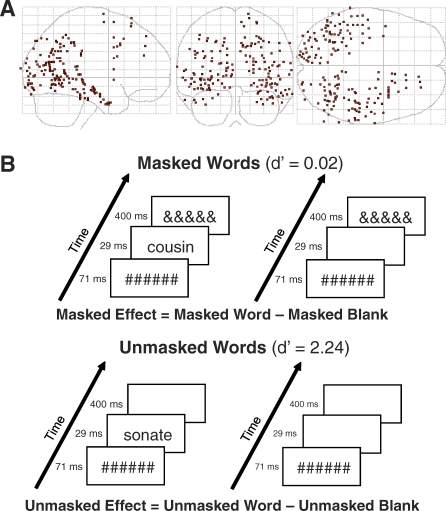
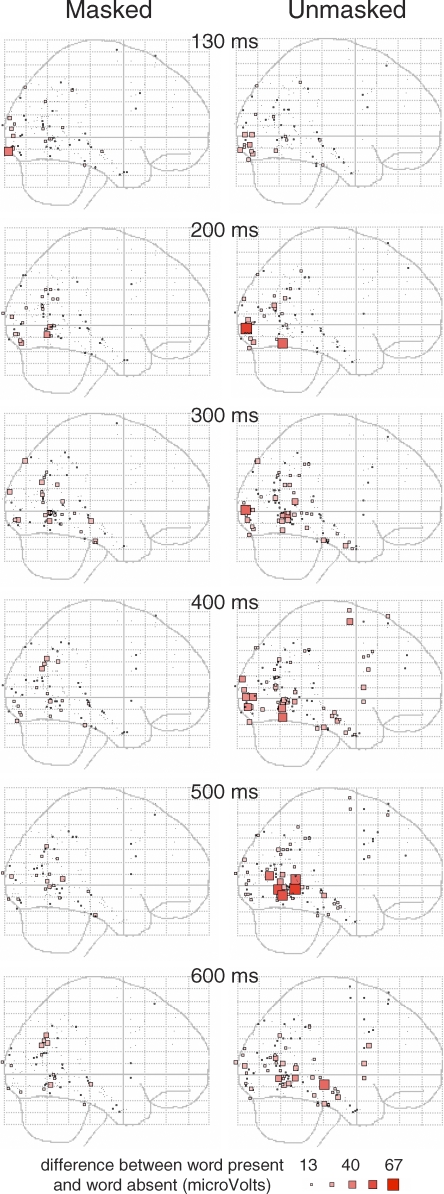
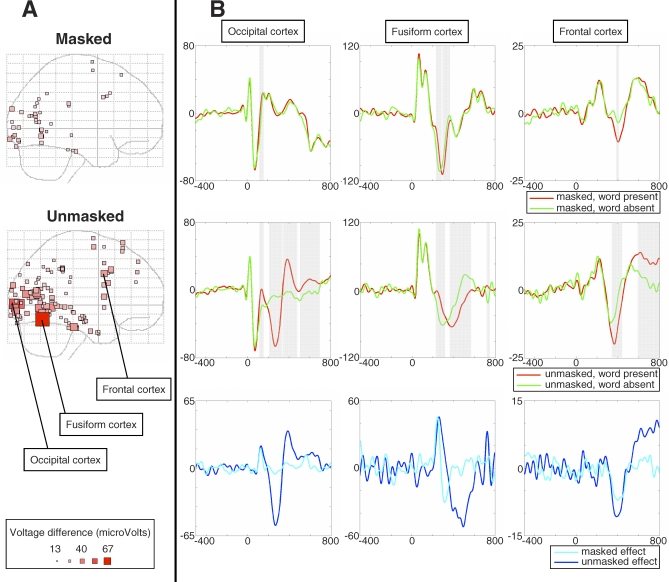
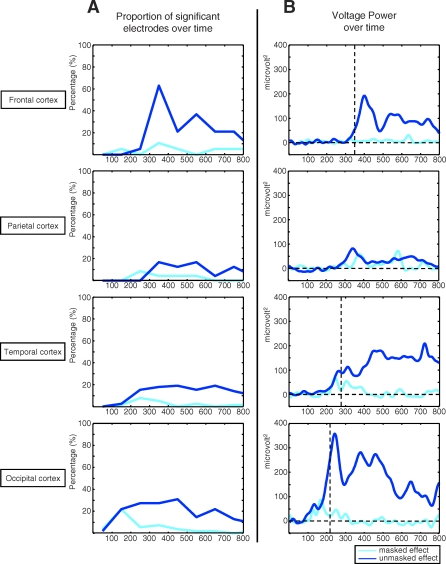
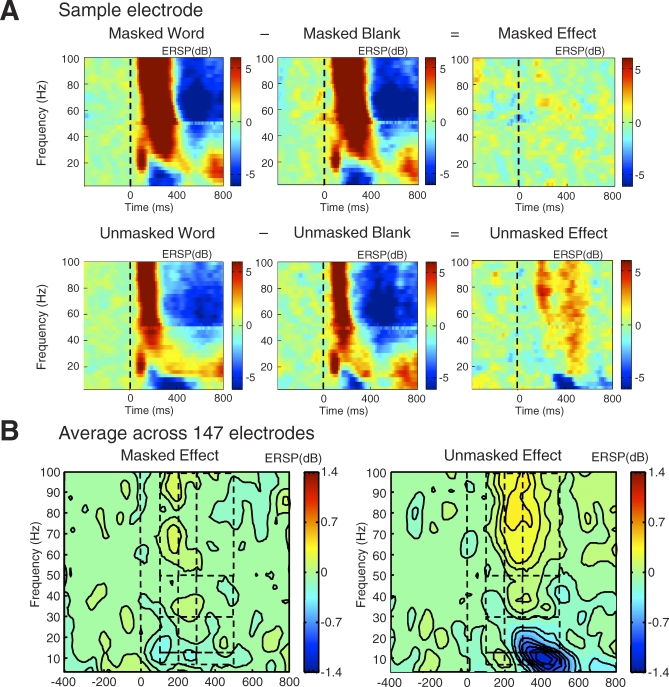
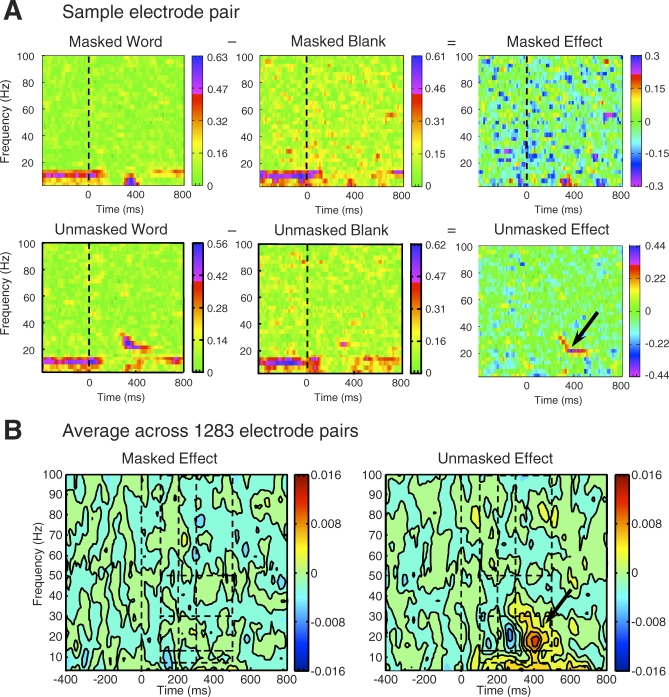
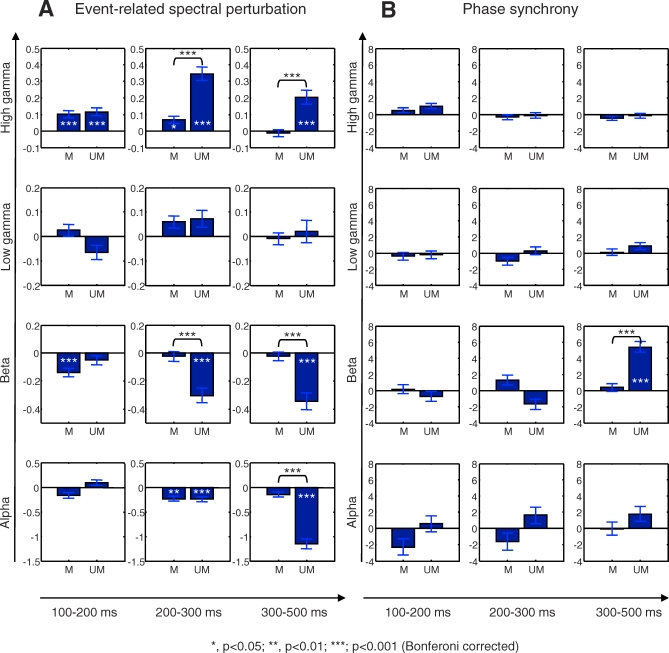
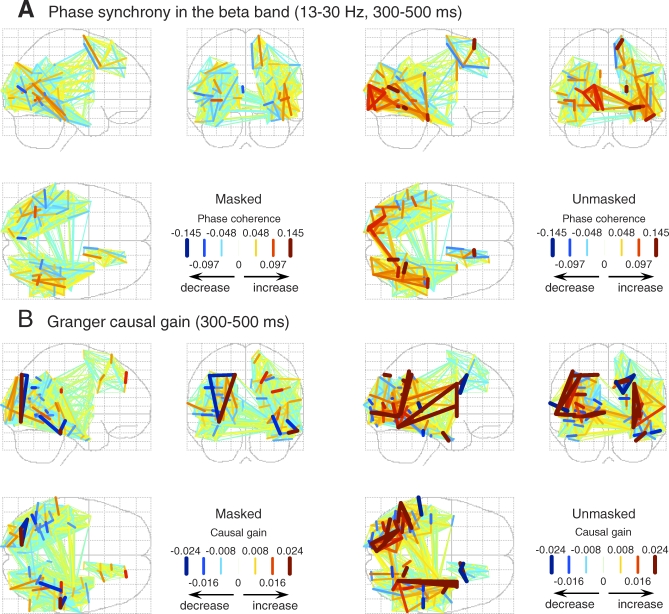
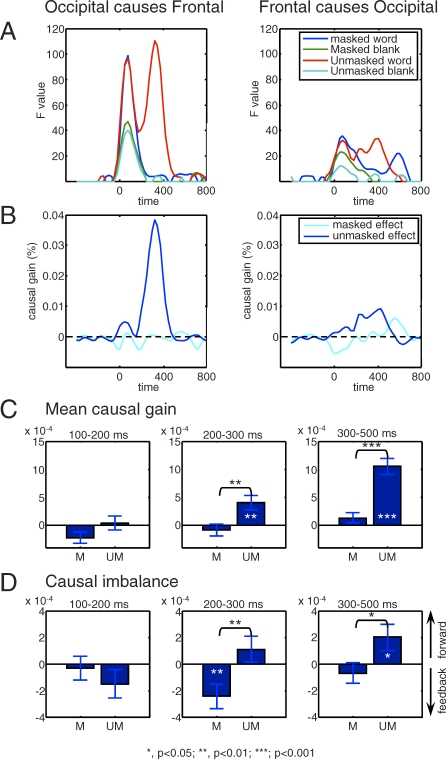
We compared conscious and nonconscious processing of briefly flashed words using a visual masking procedure while recording intracranial electroencephalogram (iEEG) in ten patients. Nonconscious processing of masked words was observed in multiple cortical areas, mostly within an early time window (<300 ms), accompanied by induced gamma-band activity, but without coherent long-distance neural activity, suggesting a quickly dissipating feedforward wave. In contrast, conscious processing of unmasked words was characterized by the convergence of four distinct neurophysiological markers: sustained voltage changes, particularly in prefrontal cortex, large increases in spectral power in the gamma band, increases in long-distance phase synchrony in the beta range, and increases in long-range Granger causality. We argue that all of those measures provide distinct windows into the same distributed state of conscious processing. These results have a direct impact on current theoretical discussions concerning the neural correlates of conscious access.
Conflict of interest statement
Competing interests. The authors have declared that no competing interests exist.
Figures
Comment in
-
Exploring the "global workspace" of consciousness.PLoS Biol. 2009 Mar;7(3):e1000066. doi: 10.1371/journal.pbio.1000066. Epub 2009 Mar 17. PLoS Biol. 2009. PMID: 20076729 Free PMC article. No abstract available.
Similar articles
-
Neural repetition suppression in ventral occipito-temporal cortex occurs during conscious and unconscious processing of frequent stimuli.Neuroimage. 2014 Jul 15;95:129-35. doi: 10.1016/j.neuroimage.2014.03.049. Epub 2014 Mar 22. Neuroimage. 2014. PMID: 24667455
-
Increased gamma-band synchrony precedes switching of conscious perceptual objects in binocular rivalry.Neuroreport. 2005 Aug 1;16(11):1139-42. doi: 10.1097/00001756-200508010-00001. Neuroreport. 2005. PMID: 16012336
-
Local category-specific gamma band responses in the visual cortex do not reflect conscious perception.J Neurosci. 2012 Oct 24;32(43):14909-14. doi: 10.1523/JNEUROSCI.2051-12.2012. J Neurosci. 2012. PMID: 23100413 Free PMC article.
-
Experimental and theoretical approaches to conscious processing.Neuron. 2011 Apr 28;70(2):200-27. doi: 10.1016/j.neuron.2011.03.018. Neuron. 2011. PMID: 21521609 Review.
-
Visual consciousness in health and disease.Neurol Clin. 2003 Aug;21(3):647-86, vi. doi: 10.1016/s0733-8619(02)00122-6. Neurol Clin. 2003. PMID: 13677817 Review.
Cited by
-
Uncovering the mechanisms of conscious face perception: a single-trial study of the n170 responses.J Neurosci. 2013 Jan 23;33(4):1337-43. doi: 10.1523/JNEUROSCI.1226-12.2013. J Neurosci. 2013. PMID: 23345210 Free PMC article.
-
A Naturalistic Approach to the Hard Problem of Consciousness.Front Syst Neurosci. 2019 Oct 25;13:58. doi: 10.3389/fnsys.2019.00058. eCollection 2019. Front Syst Neurosci. 2019. PMID: 31708755 Free PMC article.
-
N,N-dimethyltryptamine and Amazonian ayahuasca plant medicine.Hum Psychopharmacol. 2022 May;37(3):e2835. doi: 10.1002/hup.2835. Epub 2022 Feb 17. Hum Psychopharmacol. 2022. PMID: 35175662 Free PMC article. Review.
-
Are we ever aware of concepts? A critical question for the Global Neuronal Workspace, Integrated Information, and Attended Intermediate-Level Representation theories of consciousness.Neurosci Conscious. 2015 Jan;2015(1):niv006. doi: 10.1093/nc/niv006. Epub 2015 Oct 2. Neurosci Conscious. 2015. PMID: 30135741 Free PMC article.
-
Impaired conscious access and abnormal attentional amplification in schizophrenia.Neuroimage Clin. 2018 Mar 15;18:835-848. doi: 10.1016/j.nicl.2018.03.010. eCollection 2018. Neuroimage Clin. 2018. PMID: 29876269 Free PMC article.
References
-
- Del Cul A, Baillet S, Dehaene S. Brain dynamics underlying the nonlinear threshold for access to consciousness. PLoS Biol. 2007;5:e260. doi: 10.1371/journal.pbio.0050260. - DOI - PMC - PubMed
-
- Sergent C, Baillet S, Dehaene S. Timing of the brain events underlying access to consciousness during the attentional blink. Nat Neurosci. 2005;8:1391–1400. - PubMed
-
- Pins D, Ffytche D. The neural correlates of conscious vision. Cereb Cortex. 2003;13:461–474. - PubMed
-
- Super H, Spekreijse H, Lamme VA. Two distinct modes of sensory processing observed in monkey primary visual cortex (V1) Nat Neurosci. 2001;4:304–310. - PubMed
-
- Lamme VA. Towards a true neural stance on consciousness. Trends Cogn Sci. 2006;10:494–501. - PubMed
Publication types
MeSH terms
LinkOut - more resources
Full Text Sources
Other Literature Sources
