

Towards the Atlas of human African trypanosomiasis
- PMID: 19296837
- PMCID: PMC2661317
- DOI: 10.1186/1476-072X-8-15
Towards the Atlas of human African trypanosomiasis
Abstract
Background: Updated, accurate and comprehensive information on the distribution of human African trypanosomiasis (HAT), also known as sleeping sickness, is critically important to plan and monitor control activities. We describe input data, methodology, preliminary results and future prospects of the HAT Atlas initiative, which will allow major improvements in the understanding of the spatial distribution of the disease.
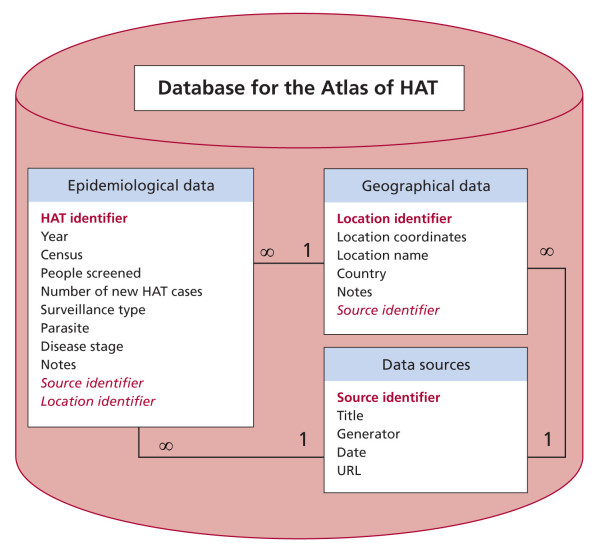
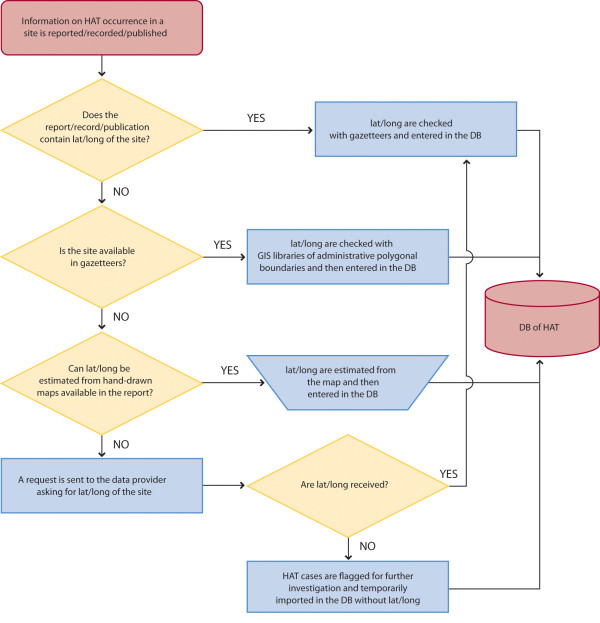
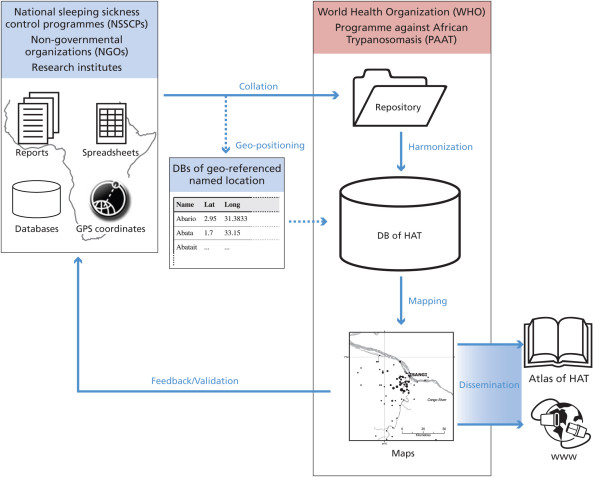
Methods: Up-to-date as well as historical data collected by national sleeping sickness control programmes, non-governmental organizations and research institutes have been collated over many years by the HAT Control and Surveillance Programme of the World Health Organization. This body of information, unpublished for the most part, is now being screened, harmonized, and analysed by means of database management systems and geographical information systems (GIS). The number of new HAT cases and the number of people screened within a defined geographical entity were chosen as the key variables to map disease distribution in sub-Saharan Africa.
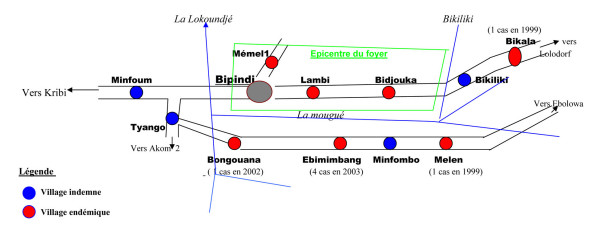
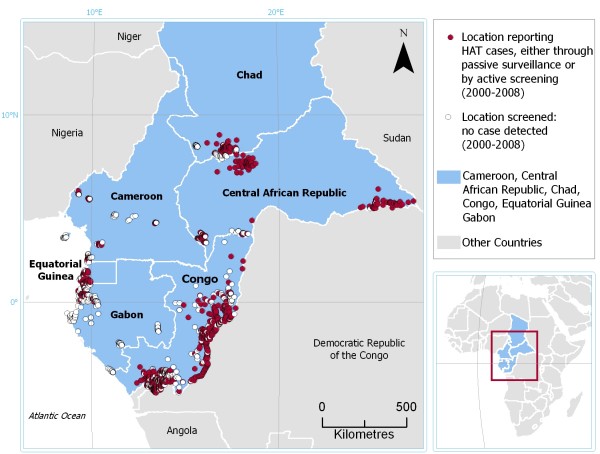
Results: At the time of writing, over 600 epidemiological reports and files from seventeen countries were collated and included in the data repository. The reports contain information on approximately 20,000 HAT cases, associated to over 7,000 different geographical entities. The oldest epidemiological records considered so far date back to 1985, the most recent having been gathered in 2008. Data from Cameroon, Central African Republic, Chad, Congo, Equatorial Guinea and Gabon from the year 2000 onwards were fully processed and the preliminary regional map of HAT distribution is presented.
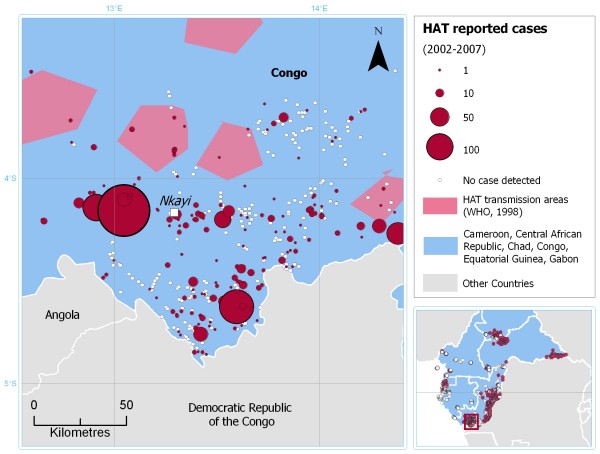
Conclusion: The use of GIS tools and geo-referenced, village-level epidemiological data allow the production of maps that substantially improve on the spatial quality of previous cartographic products of similar scope. The significant differences between our preliminary outputs and earlier maps of HAT transmission areas demonstrate the strong need for this systematic approach to mapping sleeping sickness and point to the inaccuracy of any calculation of population at risk based on previous maps of HAT transmission areas. The Atlas of HAT will lay the basis for novel, evidence-based methodologies to estimate the population at risk and the burden of disease, ultimately leading to more efficient targeting of interventions. Also, the Atlas will help streamline future field data collection in those parts of Africa that still require it.
Figures
References
-
- Onyango RJ, van Hoeve K, de Raadt P. The epidemiology of Trypanosoma rhodesiense sleeping sickness in Alego location, Central Nyanza, Kenya. I. Evidence that cattle may act as reservoir hosts of trypanosomes infective to man. Trans R Soc Trop Med Hyg. 1966;60:175–182. doi: 10.1016/0035-9203(66)90024-1. - DOI - PubMed
-
- Welburn SC, Fèvre EM, Coleman PG, Maudlin I. Epidemiology of Human African Trypanosomiasis. In: Maudlin I, Holmes PH, Miles MA, editor. The Trypanosomiases. Wallingford: CABI Publishing; 2004. pp. 219–232.
-
- World Health Organization Resolution 50.36, 50th World Health Assembly. Geneva. 1997.
Publication types
MeSH terms
Grants and funding
LinkOut - more resources
Full Text Sources
