

doi: 10.1093/bioinformatics/btp152.
Epub 2009 Mar 17.
Visualization of genomic data with the Hilbert curve
Affiliations
- PMID: 19297348
- PMCID: PMC2677744
- DOI: 10.1093/bioinformatics/btp152
Item in Clipboard
Visualization of genomic data with the Hilbert curve
Bioinformatics.
.
Abstract
In many genomic studies, one works with genome-position-dependent data, e.g. ChIP-chip or ChIP-Seq scores. Using conventional tools, it can be difficult to get a good feel for the data, especially the distribution of features. This article argues that the so-called Hilbert curve visualization can complement genome browsers and help to get further insights into the structure of one's data. This is demonstrated with examples from different use cases. An open-source application, called HilbertVis, is presented that allows the user to produce and interactively explore such plots.
Availability: http://www.ebi.ac.uk/huber-srv/hilbert/.
Figures
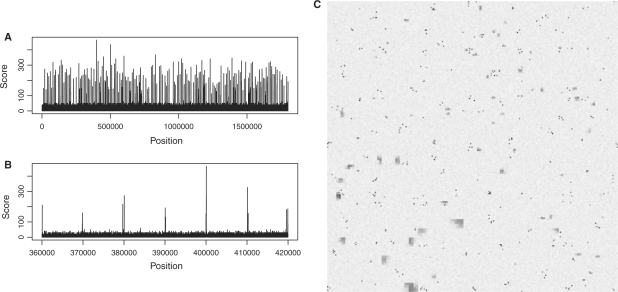
A data vector with constructed example data to demonstrate the use of HCV. (A) A standard plot of the whole vector only shows that the data seems to contain many peaks. (B) A zoom-in offers only limited insights. (C) The HCV shows (see main text) that the data contains narrow, tall peaks which appear in clusters, as well as wide peaks that are distributed randomly but have even larger width in one quarter of the vector.
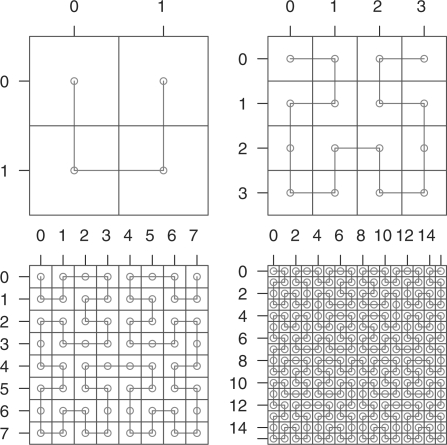
The first four iterations in the construction of the Hilbert curve. Note how each iteration consists of four rotated repetitions of the curve of the previous iteration.
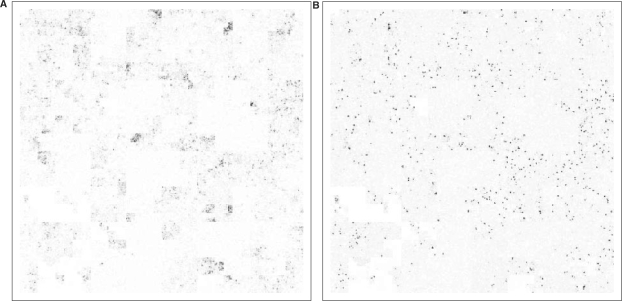
Hilbert plot the methylation marks (A) H3K4me1 and (B) H3K4me3 on human chromosome 10 according to the raw ChIP-Seq data reported by Barski et al. (2007). It is easy to see qualitative differences between mono- and tri-methylation peaks: the latter are very sharp, narrow and tall, while the former are blurred, wide and less intense. (The image is sharper on screen than in a print-out.)
Three-colour overlay of the plots from Figure 3: H3K4me1 is displayed in red, H3K4me3 in green and exonic regions in blue. The colours are additive, i.e. bins with both me1 and me3 marks appear in yellow. The sparsity of yellow pixels indicate that the two marks do not tend to occur close to each other. Furthermore, the blue colours for exons mixes with the red for me1 to purple. Comparing purple and red shows that me1 marks spread well into non-coding areas. (Colours are optimized for display on screen, not on paper.)
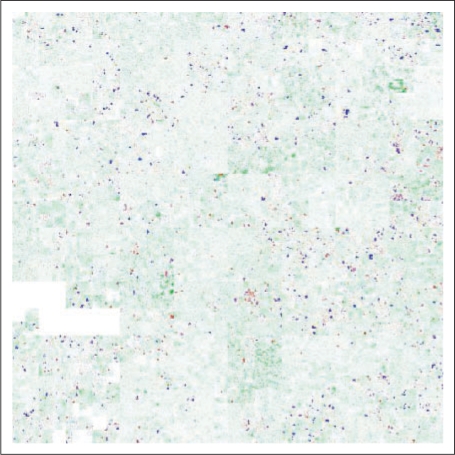
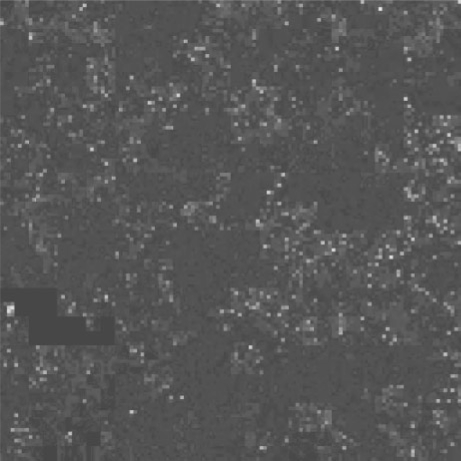
Use of HCV to illustrate how little of the highly conserved part of the human genome is coding. Depicted is the 44-way vertebrate conservation track from the UCSC Genome Browser (Kent et al., 2002) for human chromosome 10, together with the position of the exons. For non-exonic region, the conservation score is depicted with a scale from white (score 0) to green (score 1), for exons, the colour ranges from blue (score 0) via purple to red (score 1).
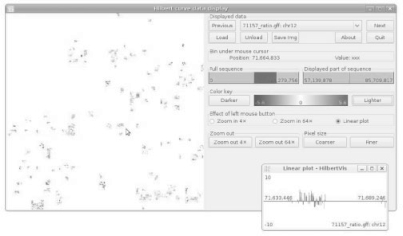
The GUI of the HilbertVis application (stand-alone version).
References
-
- Barski A, et al. High-resolution profiling of histone methylations in the human genome. Cell. 2007;129:823. - PubMed
-
- Deng X, et al. DHPC: a new tool to express genome structural features. Genomics. 2008;91:476. - PubMed
-
- Hilbert D. Über stetige Abbildungen einer Linie auf ein Flächenstück. Mathematische Annalen. 1891;38:459.
Publication types
MeSH terms
LinkOut - more resources
Full Text Sources
Other Literature Sources
Molecular Biology Databases
