

Size at birth, weight gain in infancy and childhood, and adult blood pressure in 5 low- and middle-income-country cohorts: when does weight gain matter?
- PMID: 19297457
- PMCID: PMC2720838
- DOI: 10.3945/ajcn.2008.27139
Size at birth, weight gain in infancy and childhood, and adult blood pressure in 5 low- and middle-income-country cohorts: when does weight gain matter?
Abstract
Background: Promoting catch-up growth in malnourished children has health benefits, but recent evidence suggests that accelerated child weight gain increases adult chronic disease risk.
Objective: We aimed to determine how birth weight (BW) and weight gain to midchildhood relate to blood pressure (BP) in young adults.
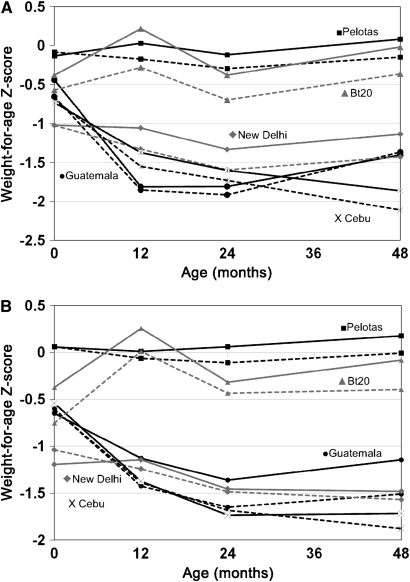
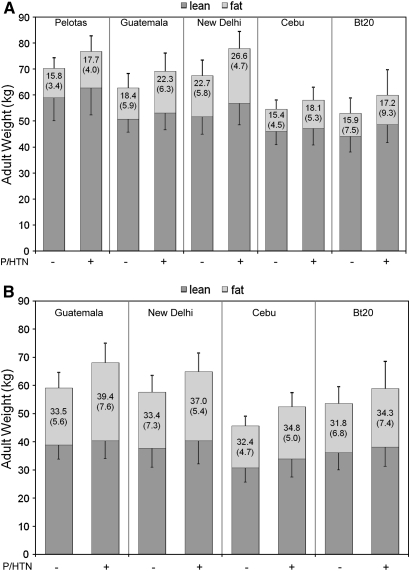
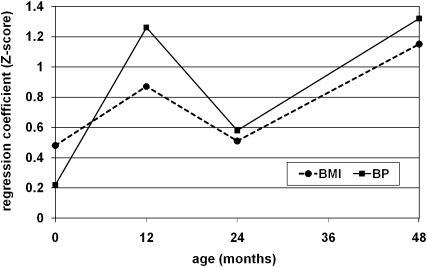
Design: We pooled data from birth cohorts in Brazil, Guatemala, India, the Philippines, and South Africa. We used conditional weight (CW), a residual of current weight regressed on prior weights, to represent deviations from expected weight gain from 0 to 12, 12 to 24, 24 to 48 mo, and 48 mo to adulthood. Adult BP and risk of prehypertension or hypertension (P/HTN) were modeled before and after adjustment for adult body mass index (BMI) and height. Interactions of CWs with small size-for-gestational age (SGA) at birth were tested.
Results: Higher CWs were associated with increased BP and odds of P/HTN, with coefficients proportional to the contribution of each CW to adult BMI. Adjusted for adult height and BMI, no child CW was associated with adult BP, but 1 SD of BW was related to a 0.5-mm Hg lower systolic BP and a 9% lower odds of P/HTN. BW and CW associations with systolic BP and P/HTN were not different between adults born SGA and those with normal BW, but higher CW at 48 mo was associated with higher diastolic BP in those born SGA.
Conclusions: Greater weight gain at any age relates to elevated adult BP, but faster weight gains in infancy and young childhood do not pose a higher risk than do gains at other ages.
Figures
References
-
- Mendez MA, Adair LS. Severity and timing of stunting in the first two years of life affect performance on cognitive tests in late childhood. J Nutr 1999;129:1555–62 - PubMed
-
- Chang SM, Walker SP, Grantham-McGregor S, Powell CA. Early childhood stunting and later behaviour and school achievement. J Child Psychol Psychiatry 2002;43:775–83 - PubMed
-
- Martorell R, Ho TJ. Malnutrition, morbidity and mortality. Popul Dev Rev 1984;10:49–68
-
- Victora CG, Barros FC. Commentary: the catch-up dilemma—relevance of Leitch's ‘low-high’ pig to child growth in developing countries. Int J Epidemiol 2001;30:217–20 - PubMed
-
- Victora CG, Barros FC, Horta BL, Martorell R. Short-term benefits of catch-up growth for small-for-gestational-age infants. Int J Epidemiol 2001;30:1325–30 - PubMed
Publication types
MeSH terms
Grants and funding
LinkOut - more resources
Full Text Sources
Medical
