. 2009 Jun;83(11):5890-903.
doi: 10.1128/JVI.01948-08. Epub 2009 Mar 18.

Early and strong immune responses are associated with control of viral replication and recovery in lassa virus-infected cynomolgus monkeys

Affiliations

Early and strong immune responses are associated with control of viral replication and recovery in lassa virus-infected cynomolgus monkeys

Sylvain Baize et al. J Virol. 2009 Jun.

Abstract

Lassa virus causes a hemorrhagic fever endemic in West Africa. The pathogenesis and the immune responses associated with the disease are poorly understood, and no vaccine is available. We followed virological, pathological, and immunological markers associated with fatal and nonfatal Lassa virus infection of cynomolgus monkeys. The clinical picture was characterized by fever, weight loss, depression, and acute respiratory syndrome. Transient thrombocytopenia and lymphopenia, lymphadenopathy, splenomegaly, infiltration of mononuclear cells, and alterations of the liver, lungs, and endothelia were observed. Survivors exhibited fewer lesions and a lower viral load than nonsurvivors. Although all animals developed strong humoral responses, antibodies appeared more rapidly in survivors and were directed against GP(1), GP(2), and NP. Type I interferons were detected early after infection in survivors but only during the terminal stages in fatalities. The mRNAs for CXCL10 (IP-10) and CXCL11 (I-TAC) were abundant in peripheral blood mononuclear cells and lymph nodes from infected animals, but plasma interleukin-6 was detected only in fatalities. In survivors, high activated-monocyte counts were followed by a rise in the total number of circulating monocytes. Activated T lymphocytes circulated in survivors, whereas T-cell activation was low and delayed in fatalities. In vitro stimulation with inactivated Lassa virus induced activation of T lymphocytes from all infected monkeys, but only lymphocytes from survivors proliferated. Thus, early and strong immune responses and control of viral replication were associated with recovery, whereas fatal infection was characterized by major alterations of the blood formula and, in organs, weak immune responses and uncontrolled viral replication.


Figures

FIG. 1.
FIG. 1.
Hepatic enzyme levels and blood composition during the course of Lassa fever. (A and B) Concentrations of AST (A) and ALT (B) were determined in plasma from fatally infected monkeys (red squares), the low-dose-infected survivor (green squares), high-dose-infected survivors (blue circles), and mock-infected monkeys (white circles). (C) Platelet counts were determined in the blood of monkeys during the course of the disease. (D to I) The numbers of circulating CD4+ (D) and CD8+ (E) T cells, B cells (F), NK cells (CD3-CD8+) (G), granulocytes (H), and monocytes (I) in animals were determined by flow cytometry during the course of LV infection.
FIG. 2.
FIG. 2.
Pathology in fatally infected cynomolgus monkeys. Tissues were obtained at necropsy from one monkey found dead (A to D and F to H) and from another euthanized when moribund (E and I). (A and B) Acidophilic necrosis in hepatocytes from the centrolobular zone (A) and inflammatory cell infiltrate in the sinusoids (B) of the liver. (C) Acute alveolitis and endothelitis in the lungs. (D) Fibrino-leukocytic coating on the pleural membrane. (E) Perivascular mononuclear cell infiltrate in the kidney. (F) Macrophagic hyperplasia in lymphoid follicles. (G) Hyperplasia of the splenic white pulp and numerous macrophages in the lymphoid cluster. (H) Hyperplasia of the white pulp and intense congestion of the red pulp in the spleen. (I) Substantial lesions of necrosing pancreatitis and destroyed parenchyma in the pancreas.
FIG. 3.
FIG. 3.
Viremia and tissue viral load during Lassa fever in cynomolgus monkeys. (A) The numbers of viral-RNA copies in plasma from fatally infected monkeys (black circles), the low-dose-infected survivor (white circles), and high-dose-infected survivors (gray circles) were determined by quantitative RT-PCR. (B) The number of infectious viral particles was also determined in plasma from the same animals by titration on Vero E6 cells. (C) The ratio of viral-RNA copies to the infectious titer was calculated for plasma samples from LV-infected monkeys and is represented as in panel A. (D) Infectious viral titers in organs (LN, lymph nodes) obtained at necropsy from fatally infected monkeys were determined by titration. (E) The numbers of viral-RNA copies in organs obtained at necropsy from fatally infected monkeys (16 and 21 days after infection) (black bars), the low-dose-infected survivor (day 28) (light-gray bars), and high-dose-infected survivors (days 30 to 34) (dark-gray bars) were determined by quantitative RT-PCR.
FIG. 4.
FIG. 4.
Analysis of humoral responses during Lassa fever. (A and B) LV-specific IgM (A) and IgG (B) were detected by ELISA in plasma collected during the course of the disease. The results are expressed as optical densities (OD) of plasma at a dilution of 1:1,600 for IgM and of 1:25,600 for IgG. See the legend to Fig. 1 for symbols. (C) Western blotting for NP-, GP1-, and GP2-specific IgG in plasma from LV-infected monkeys. The molecular masses of the viral proteins were verified using standard molecular masses and were about 66 kDa for NP, 45 kDa for GP1, and 38 to 39 kDa for GP2. The results at various times after LV infection (in days, shown above the lanes) are presented for individual fatally infected monkeys (Fatal) and survivors (Surv.) infected with a low (low d.) or a high (high d.) viral dose. One sample from a mock-infected monkey (Ctl) is shown and is representative of all samples from the two control animals (data not shown).
FIG. 5.
FIG. 5.
T-cell and monocyte activation during Lassa fever. The numbers of circulating CD3+ CD8+ cells expressing CD69 (A, top) or CD25 (A, bottom), of CD3+ CD4+ cells expressing CD69 (B, top) or CD25 (B, bottom), and of monocytes expressing CD80 (F) are shown. See the legend to Fig. 1 for symbols. (C) The percentages of CD3+ cells that were CD28+ in the blood from fatally infected monkeys (Fatal inf.) and survivors (Surv.) were determined 16 days after infection. The mean and standard error of all samples (n = 16) from mock-infected animals (Mock) is given. The number of CD3+ CD28+ cells is also indicated (number of cells/μl of blood for infected monkeys and mean number/μl ± standard error for control animals). The mean and standard error of data from the four survivors are shown, and significant differences were found with control animals (P = 0.004). (D and E) The intensity of expression at the surface of circulating monocytes of HLA-a, -b, and -c (D) and CD95 (E) was evaluated by flow cytometry 6 days after infection in infected monkeys (Infect.) and control animals (Mock). The results are expressed as the mean and standard error of the fluorescence index (MFI) of molecule expression for all infected monkeys (n = 6) and for all control samples (n = 16). The results of the statistical tests performed to compare control and infected animals are indicated. (G and H) The percentages of lymph node-derived CD4+ and CD8+ T lymphocytes (obtained 9 days after infection of the monkeys) expressing KI67 (G) or CD25 (H) after in vitro mock or inactivated LV stimulation. Note the change of scale in the vertical axis for CD4+ T cells and KI67 and the logarithmic scale for CD8+ T cells and CD25. See the legend to Fig. 1 for symbols.
FIG. 6.
FIG. 6.
Detection of the expression of IL-6, type I IFN, and CXC chemokines by ELISA or RT-PCR. (A to C) IL-6 (A) and IFN-α (B) were assayed by ELISA in plasma collected during the course of the disease, and IFN-β mRNA in PBMC obtained during the course of disease was assayed by quantitative RT-PCR (C). The results are expressed as IU/ml (IL-6), pg/ml (IFN-α), or numbers of copies of IFN-β mRNA/number of copies of β-actin mRNA, and the different monkeys are represented as in Fig. 1. IFN-α levels were below the detection threshold of the test in samples from control monkeys, and the relative IFN-β mRNA abundance was <9 × 10⁻⁶ for all samples (data not shown). (D and E) The titers of CXCL10 (D) and CXCL11 (E) mRNAs in PBMC obtained 6 days after infection were determined by quantitative RT-PCR (see the legend to Fig. 5C for symbols). The results reported are the numbers of copies of the mRNA considered/number of copies of β-actin mRNA for individual monkeys, except for control animals, for which the mean ± standard error of all samples is given. The mean and standard error of all samples from infected monkeys (n = 6) are indicated, as are the results of the statistical test comparing mRNA expression between infected and control monkeys. The titers of CXCL10 (F) and CXCL11 (G) mRNAs were also determined in lymph nodes (LN) obtained 9 days after infection. However, as the expression of CXCL10 was different between fatally infected animals and survivors, the mean for infected monkeys was calculated only with data from surviving animals (n = 4).
FIG. 7.
FIG. 7.
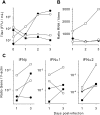
Consequences of the MOI for the replication of LV and for the production of type I IFN in human macrophages. (A) Macrophages were obtained after differentiation in the presence of macrophage colony-stimulating factor of monocytes purified from healthy human blood, as previously described (2). The macrophages were infected with LV at MOI of 0.01 (black circles), 0.1 (white circles), 1 (black squares), and 10 (white squares), and the titer of viral particles in the supernatants was determined after infection. (B) Viral RNA/titer ratio in culture supernatants. (C) Total cellular RNA was extracted 24 h and 72 h after infection of macrophages with LV at MOI of 0.01 (white circles), 0.1 (black squares), and 2 (white squares) or after mock infection (black circles), and the titers of mRNAs coding for IFN-β, IFN-α1, and IFN-α2 were determined by real-time RT-PCR using primers and probes previously described (3).

References

    1. Asper, M., T. Sternsdorf, M. Hass, C. Drosten, A. Rhode, H. Schmitz, and S. Günther. 2004. Inhibition of different Lassa virus strains by alpha and gamma interferons and comparison with a less pathogenic arenavirus. J. Virol. 783162-3169. - PMC - PubMed
    1. Baize, S., J. Kaplon, C. Faure, D. Pannetier, M. C. Georges-Courbot, and V. Deubel. 2004. Lassa virus infection of dendritic cells and macrophages is productive but fails to activate cells. J. Immunol. 1722861-2869. - PubMed
    1. Baize, S., D. Pannetier, C. Faure, P. Marianneau, I. Marendat, M. C. Georges-Courbot, and V. Deubel. 2006. Role of interferons in the control of Lassa virus replication in human dendritic cells and macrophages. Microbes Infect. 81194-1202. - PubMed
    1. Borish, L., R. Rosenbaum, L. Albury, and S. Clark. 1989. Activation of neutrophils by recombinant interleukin 6. Cell. Immunol. 121280-289. - PubMed
    1. Bruns, M., A. Gessner, H. Lother, and F. Lehmann-Grube. 1988. Host cell-dependent homologous interference in lymphocytic choriomeningitis virus infection. Virology 166133-139. - PubMed

Publication types

LinkOut - more resources