. 2009 Apr;20(4):765-76.
doi: 10.1681/ASN.2008060566. Epub 2009 Mar 18.

Wnt/beta-catenin signaling promotes renal interstitial fibrosis

Affiliations

Wnt/beta-catenin signaling promotes renal interstitial fibrosis

Weichun He et al. J Am Soc Nephrol. 2009 Apr.

Abstract

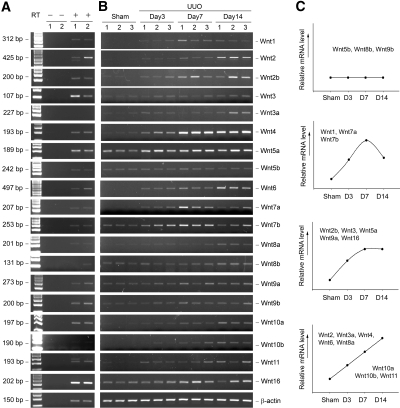
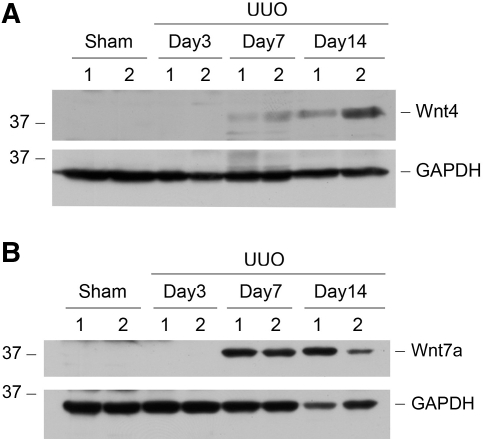
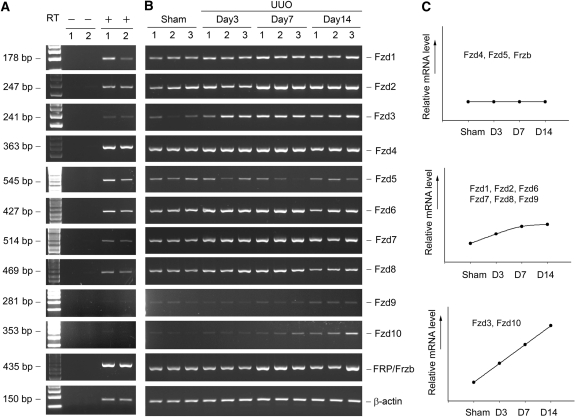
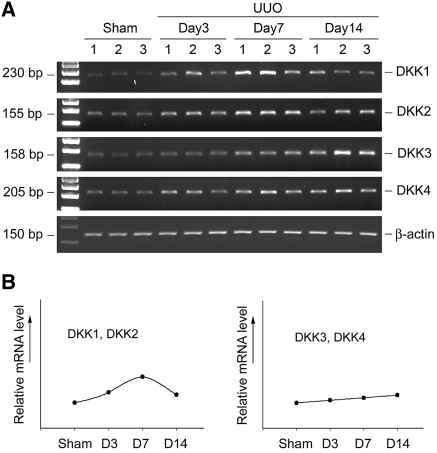
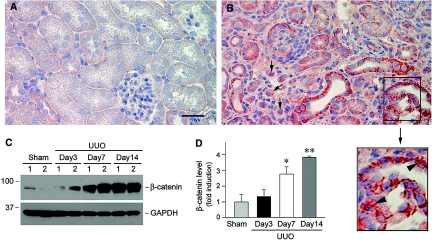
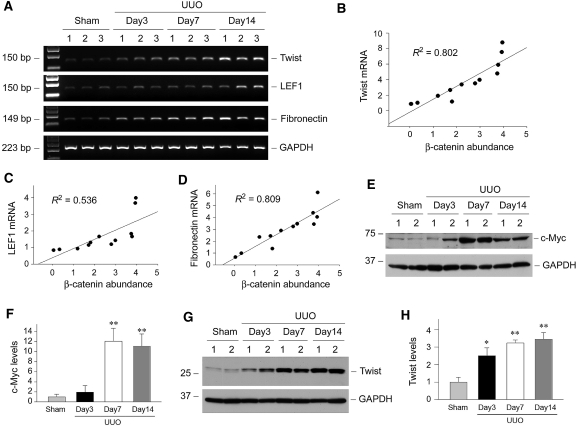
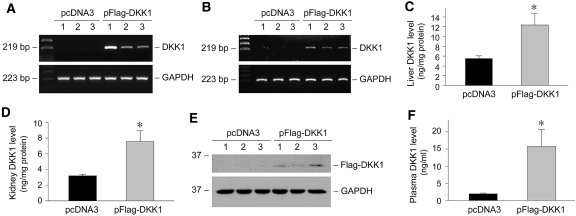
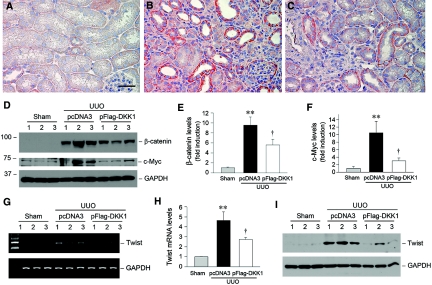
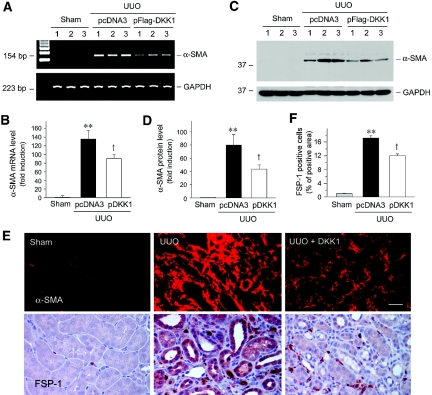
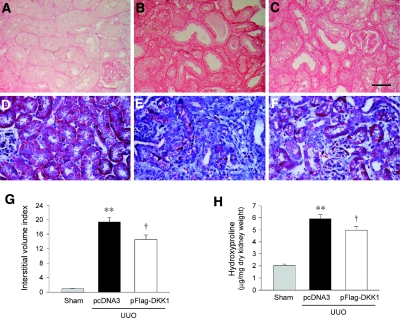
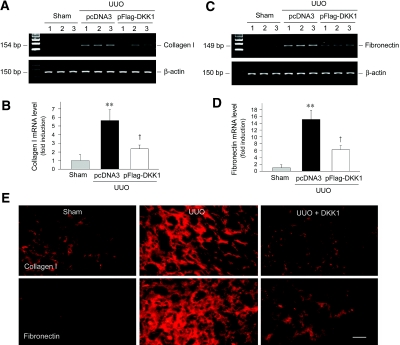
Wnts compose a family of signaling proteins that play an essential role in kidney development, but their expression in adult kidney is thought to be silenced. Here, we analyzed the expression and regulation of Wnts and their receptors and antagonists in normal and fibrotic kidneys after obstructive injury. In the normal mouse kidney, the vast majority of 19 different Wnts and 10 frizzled receptor genes was expressed at various levels. After unilateral ureteral obstruction, all members of the Wnt family except Wnt5b, Wnt8b, and Wnt9b were upregulated in the fibrotic kidney with distinct dynamics. In addition, the expression of most Fzd receptors and Wnt antagonists was also induced. Obstructive injury led to a dramatic accumulation of beta-catenin in the cytoplasm and nuclei of renal tubular epithelial cells, indicating activation of the canonical pathway of Wnt signaling. Numerous Wnt/beta-catenin target genes (c-Myc, Twist, lymphoid enhancer-binding factor 1, and fibronectin) were induced, and their expression was closely correlated with renal beta-catenin abundance. Delivery of the Wnt antagonist Dickkopf-1 gene significantly reduced renal beta-catenin accumulation and inhibited the expression of Wnt/beta-catenin target genes. Furthermore, gene therapy with Dickkopf-1 inhibited myofibroblast activation; suppressed expression of fibroblast-specific protein 1, type I collagen, and fibronectin; and reduced total collagen content in the model of obstructive nephropathy. In summary, these results establish a role for Wnt/beta-catenin signaling in the pathogenesis of renal fibrosis and identify this pathway as a potential therapeutic target.


Figures

Figure 1.
Figure 1.
Expression of Wnt genes in normal and fibrotic mouse kidneys. (A) Representative RT-PCR results show the expression of different Wnt genes in normal mouse kidney. In the absence of RT, no PCR product was detected, suggesting the specificity. (B) Representative RT-PCR results demonstrate the steady-state levels of renal Wnt mRNA at different time points after UUO as indicated. Numbers (1, 2, and 3) indicate each individual animal in a given group. (C) Graphic presentation shows the distinct, dynamic pattern of Wnt regulation in the fibrotic kidney. Different Wnts with similar dynamic pattern after injury were grouped. The actual values of relative mRNA levels (fold induction over sham controls) are presented in Supplemental Table 1.
Figure 2.
Figure 2.
Induction of renal Wnt4 and Wnt7a protein expression after obstructive injury. Whole-kidney homogenates were prepared at different time points after UUO as indicated and immunoblotted with antibodies against Wnt4, Wnt7a, and glyceraldehyde-3-phosphate dehydrogenase (GAPDH), respectively. Numbers (1 and 2) indicate each individual animal in a given group.
Figure 3.
Figure 3.
Regulation of the Fzd receptor genes in normal and fibrotic kidneys. (A) Representative RT-PCR results show the expression of different Fzd receptor genes in mouse kidney. In the absence of RT, no PCR product was detected, suggesting the specificity. (B) Representative RT-PCR results demonstrate the steady-state levels of renal Fzd mRNA at different time points after UUO as indicated. Numbers (1, 2, and 3) indicate each individual animal. (C) Graphic presentation shows the dynamic pattern of Fzd regulation in the fibrotic kidney. Different Fzd receptors with similar expression pattern after injury were grouped. The actual values of relative mRNA levels (fold induction over sham controls) are presented in Supplemental Table 2.
Figure 4.
Figure 4.
Expression of Wnt antagonists in obstructive nephropathy. (A) Representative RT-PCR results demonstrate the steady-state levels of various Dickkopf (DKK1 through 4) mRNA at different time points after UUO as indicated. Numbers (1, 2, and 3) indicate each individual animal. (B) Graphic presentation shows the dynamic pattern of DKK regulation in the fibrotic kidney. DKKs with similar expression pattern after injury were grouped.
Figure 5.
Figure 5.
Activation of the Wnt/β-catenin canonical pathway in obstructive nephropathy. (A and B) Representative micrographs demonstrate the accumulation and localization of β-catenin in fibrotic kidney. Kidneys from sham (A) and UUO for 7 d (B) were stained immunohistochemically for β-catenin protein. Bar = 40 μm. Arrows indicate β-catenin–positive cells in the interstitium. Arrowheads in the enlarged box area indicate positive nuclear staining. (C and D) Western blot analysis shows a dramatic increase in renal β-catenin abundance after obstructive injury. Representative Western blot (C) and quantitative data (D) are presented. Relative β-catenin levels (fold induction over sham controls) were reported after normalizing with GAPDH. Data are means ± SEM of five animals per group. *P < 0.05, **P < 0.01 versus sham controls.
Figure 6.
Figure 6.
Expression of Wnt/β-catenin target genes in obstructive nephropathy. (A) RT-PCR analysis shows the induction of putative Wnt/β-catenin target genes in the obstructed kidney at different time points after UUO. (B through D) Linear regression shows a close correlation between renal Twist (B), LEF1 (C), and fibronectin (D) mRNA levels and β-catenin abundance (arbitrary units). The correlation coefficients (R2) are shown. (E through H) Western blot analyses demonstrate a dramatic increase in renal c-Myc and Twist protein abundance after obstructive injury. Representative Western blot (E and G) and quantitative data (F and H) are presented. Relative c-Myc and Twist protein levels (fold induction over sham controls) are reported after normalization with GAPDH. Data are means ± SEM of five animals per group. *P < 0.05, **P < 0.01 versus sham controls.
Figure 7.
Figure 7.
Expression of exogenous DKK1 after gene therapy. (A and B) RT-PCR analysis demonstrates the expression of exogenous DKK1 gene in liver (A) and kidney (B) after plasmid injection. Total RNA was prepared from liver and kidney at 16 h after DKK1 plasmid injected and subjected to RT-PCR analysis for human DKK1 expression. Numbers (1, 2, and 3) indicate each individual animal in a given group. (C and D) ELISA analysis shows an increased DKK1 protein in liver (C) and kidney (D) after gene delivery. DKK1 protein levels in liver and kidney homogenates were expressed as ng/mg total protein. *P < 0.05 versus pcDNA3 controls (n = 4 to 5). (E) Western blot analysis demonstrates renal expression of exogenous DKK1 protein. Kidney homogenates were immunoblotted with anti-Flag and anti-GAPDH antibodies, respectively. (F) ELISA analysis shows an increased DKK1 protein in the circulation after gene delivery. Plasma samples were collected from the mice at 16 h after DKK1 plasmid injection, and DKK1 protein levels were expressed as ng/ml. *P < 0.05 versus pcDNA3 controls (n = 3).
Figure 8.
Figure 8.
Delivery of DKK1 gene blocks Wnt/β-catenin signaling in obstructive nephropathy. (A through C) Representative micrographs demonstrate renal β-catenin expression and localization in sham mice (A), mice that underwent UUO and were administered an injection of pcDNA3 (B), and mice that underwent UUO and were administered an injection of pFlag-DKK1 plasmid (C). Bar = 40 μm. (D through F) Representative Western blots (D) and quantitative data (E and F) show that delivery of DKK1 gene reduced renal β-catenin and c-Myc abundance after obstructive injury. **P < 0.01 versus sham controls; P < 0.05 versus pcDNA3 (n = 4 to 5). (G through I) DKK1 gene therapy suppresses Twist mRNA (G and H) and protein (I) expression in obstructed kidney. Representative RT-PCR (G) and Western blot (I) results and quantitative data (H) are presented. **P < 0.01 versus sham controls; P < 0.05 versus pcDNA3 (n = 4 to 5).
Figure 9.
Figure 9.
Blockade of Wnt signaling by DKK1 inhibits α-SMA and FSP-1 expression in the obstructed kidney. (A and B) Representative RT-PCR analysis (A) and quantitative data (B) show that delivery of DKK1 gene suppressed renal α-SMA mRNA expression after obstructive injury. (C and D) Representative Western blot (C) and quantitative data (D) demonstrate that DKK1 suppressed renal α-SMA protein expression after obstructive injury. Numbers (1, 2, and 3) denote each individual animal in a given group. Relative α-SMA mRNA (B) or protein (D) levels (fold induction over sham controls) were reported after normalization with GAPDH, respectively. **P < 0.01 versus sham controls; P < 0.05 versus pcDNA3 (n = 4 to 5). (E) Representative micrographs demonstrate α-SMA protein localization by immunofluorescence staining and FSP-1 protein by immunohistochemical staining in different groups as indicated. Bar = 40 μm. (F) Quantitative determination of FSP-1 expression in different groups as indicated. **P < 0.01 versus sham controls; P < 0.05 versus pcDNA3 (n = 4 to 5).
Figure 10.
Figure 10.
Inhibition of Wnt signaling by DKK1 reduces renal interstitial injury and total collagen deposition after UUO. (A through F) Kidney sections were stained with Picrosirius red (A through C) and Masson trichrome (D through F) for assessment of collagen deposition. Representative micrographs from different groups as indicated are shown. (A and D) Sham controls. (B and E) Mice that underwent UUO and were administered an injection of pcDNA3. (C and F) Mice that underwent UUO and were administered an injection of pFlag-DKK1. Bar = 40 μm. (G) Graphic presentation shows renal interstitial volume in different groups as indicated. (H) DKK1 treatment reduced tissue hydroxyproline content in the obstructed kidney. Tissue hydroxyproline was expressed μg/mg dry kidney weight. **P < 0.01 versus sham controls; P < 0.05 versus pcDNA3 (n = 4 to 5).
Figure 11.
Figure 11.
Blockade of Wnt signaling by DKK1 inhibits type I collagen and fibronectin expression in obstructive nephropathy. (A and C) Representative RT-PCR analysis of renal mRNA levels of type I collagen (A) and fibronectin (C) in different treatment groups as indicated. Numbers (1, 2, and 3) denote each individual animal in a given group. (B and D) Graphic presentation of the mRNA levels of type I collagen (B) and fibronectin (D) in different groups. Relative mRNA levels were calculated and are expressed as fold induction over sham controls (value = 1.0) after normalization with β-actin. **P < 0.01 versus sham controls; P < 0.05 versus pcDNA3 (n = 4 to 5). (E) Representative micrographs demonstrate type I collagen and fibronectin localization by immunofluorescence staining in different groups as indicated. Bar = 40 μm.

Similar articles

Cited by

References

    1. Clevers H: Wnt/beta-catenin signaling in development and disease. Cell 127: 469–480, 2006 - PubMed
    1. Pinto D, Clevers H: Wnt control of stem cells and differentiation in the intestinal epithelium. Exp Cell Res 306: 357–363, 2005 - PubMed
    1. Thompson MD, Monga SP: WNT/beta-catenin signaling in liver health and disease. Hepatology 45: 1298–1305, 2007 - PubMed
    1. Fodde R, Brabletz T: Wnt/beta-catenin signaling in cancer stemness and malignant behavior. Curr Opin Cell Biol 19: 150–158, 2007 - PubMed
    1. Huang H, He X: Wnt/beta-catenin signaling: new (and old) players and new insights. Curr Opin Cell Biol 20: 119–125, 2008 - PMC - PubMed

Publication types

MeSH terms