Potential of rapid diagnosis for controlling drug-susceptible and drug-resistant tuberculosis in communities where Mycobacterium tuberculosis infections are highly prevalent
- PMID: 19297604
- PMCID: PMC2681859
- DOI: 10.1128/JCM.02289-08
Potential of rapid diagnosis for controlling drug-susceptible and drug-resistant tuberculosis in communities where Mycobacterium tuberculosis infections are highly prevalent
Abstract
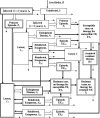
The long-term persistence of Mycobacterium tuberculosis in communities with high tuberculosis prevalence is a serious problem aggravated by the presence of drug-resistant tuberculosis strains. Drug resistance in an individual patient is often discovered only after a long delay, particularly if the diagnosis is based on current culture-based drug sensitivity testing methods. During such delays, the patient may transmit tuberculosis to his or her contacts. Rapid diagnosis of drug resistance would be expected to reduce this transmission and hence to decrease the prevalence of drug-resistant strains. To investigate this quantitatively, a mathematical model was constructed, assuming a homogeneous population structure typical of communities in South Africa where tuberculosis incidence is high. Computer simulations performed with this model showed that current control strategies will not halt the spread of multidrug-resistant tuberculosis in such communities. The simulations showed that the rapid diagnosis of drug resistance can be expected to reduce the incidence of drug-resistant cases provided the additional measure of screening within the community is implemented.
Figures


References
-
- Achonu, C., et al. 2006. Evidence for local transmission and reactivation of tuberculosis in the Toronto Somali community. Scand. J. Infect. Dis. 38778-781. - PubMed
-
- Barnard, M., et al. 2008. Rapid molecular screening for multidrug-resistant tuberculosis in a high-volume public health laboratory in South Africa. Am. J. Respir. Crit. Care Med. 177787-792. - PubMed
-
- Bechan, S., et al. 1997. Directly observed therapy for tuberculosis given twice weekly in the workplace in urban South Africa. Trans. R. Soc. Trop. Med. Hyg. 91704-707. - PubMed
-
- Behr, M. A., S. A. Warren, H. Salamon, P. C. Hopewell, A. Ponce de Leon, C. L. Daley, and P. M. Small. 1999. Transmission of Mycobacterium tuberculosis from patients smear-negative for acid-fast bacilli. Lancet 353444-449. - PubMed
-
- Beyers, N., et al. 1996. The use of a geographical information system (GIS) to evaluate the distribution of tuberculosis in a high-incidence community. S. Afr. Med. J. 8640-41, 44. - PubMed
Publication types
MeSH terms
LinkOut - more resources
Full Text Sources

