

Retinoic acid induces nuclear accumulation of Raf1 during differentiation of HL-60 cells
- PMID: 19298812
- PMCID: PMC2696568
- DOI: 10.1016/j.yexcr.2009.03.004
Retinoic acid induces nuclear accumulation of Raf1 during differentiation of HL-60 cells
Abstract
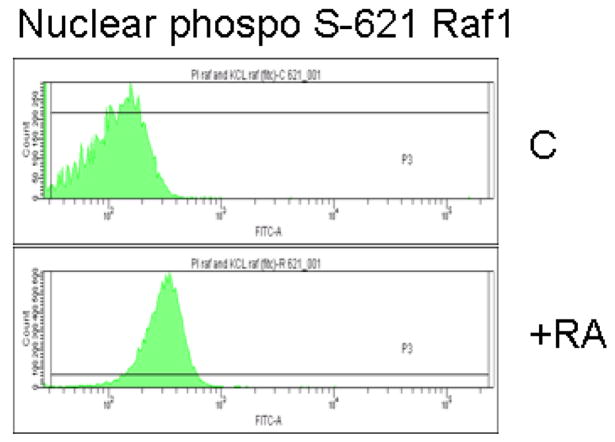
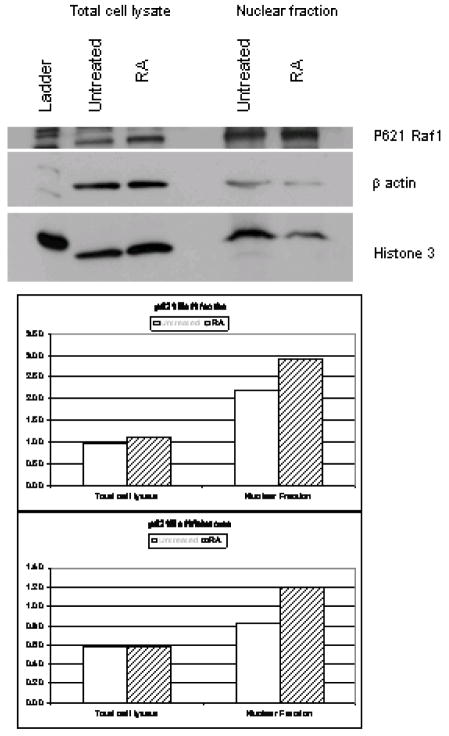
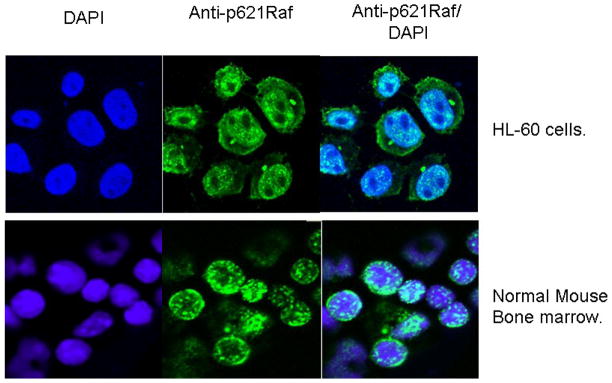
All trans-retinoic acid (RA) is a standard therapeutic agent used in differentiation induction therapy treatment of acute promyelocytic leukemia (APL). RA and its metabolites use a diverse set of signal transduction pathways during the differentiation program. In addition to the direct transcriptional targets of the nuclear RAR and RXR receptors, signals derived from membrane receptors and the Raf-MEK-ERK pathway are required. Raf1 phosphorylation and the prolonged activation of Raf1 persisting during the entire differentiation process are required for RA-dependent differentiation of HL-60 cells. Here we identify a nuclear redistribution of Raf1 during the RA-induced differentiation of HL-60 cells. In addition, the nuclear accumulation of Raf1 correlates with an increase in Raf1 phosphorylated at serine 621. The serine 621 phosphorylated Raf1 is predominantly localized in the nucleus. The RA-dependent nuclear accumulation of Raf1 suggests a novel nuclear role for Raf1 during the differentiation process.
Figures


Similar articles
-
GW5074 and PP2 kinase inhibitors implicate nontraditional c-Raf and Lyn function as drivers of retinoic acid-induced maturation.Cell Signal. 2015 Aug;27(8):1666-75. doi: 10.1016/j.cellsig.2015.03.014. Epub 2015 Mar 26. Cell Signal. 2015. PMID: 25817574 Free PMC article.
-
Dissecting the novel partners of nuclear c-Raf and its role in all-trans retinoic acid (ATRA)-induced myeloblastic leukemia cells differentiation.Exp Cell Res. 2020 Sep 1;394(1):111989. doi: 10.1016/j.yexcr.2020.111989. Epub 2020 Apr 10. Exp Cell Res. 2020. PMID: 32283065 Free PMC article.
-
Retinoic acid causes MEK-dependent RAF phosphorylation through RARalpha plus RXR activation in HL-60 cells.Differentiation. 2001 Aug;68(1):55-66. doi: 10.1046/j.1432-0436.2001.068001055.x. Differentiation. 2001. PMID: 11683493
-
Retinoic acid induced mitogen-activated protein (MAP)/extracellular signal-regulated kinase (ERK) kinase-dependent MAP kinase activation needed to elicit HL-60 cell differentiation and growth arrest.Cancer Res. 1998 Jul 15;58(14):3163-72. Cancer Res. 1998. PMID: 9679985
-
Mechanisms of all-trans retinoic acid-induced differentiation of acute promyelocytic leukemia cells.J Biosci. 2000 Sep;25(3):275-84. doi: 10.1007/BF02703936. J Biosci. 2000. PMID: 11022230 Review.
Cited by
-
The AhR agonist VAF347 augments retinoic acid-induced differentiation in leukemia cells.FEBS Open Bio. 2015 Apr 8;5:308-18. doi: 10.1016/j.fob.2015.04.002. eCollection 2015. FEBS Open Bio. 2015. PMID: 25941627 Free PMC article.
-
GW5074 and PP2 kinase inhibitors implicate nontraditional c-Raf and Lyn function as drivers of retinoic acid-induced maturation.Cell Signal. 2015 Aug;27(8):1666-75. doi: 10.1016/j.cellsig.2015.03.014. Epub 2015 Mar 26. Cell Signal. 2015. PMID: 25817574 Free PMC article.
-
Importin beta plays an essential role in the regulation of the LysRS-Ap(4)A pathway in immunologically activated mast cells.Mol Cell Biol. 2011 May;31(10):2111-21. doi: 10.1128/MCB.01159-10. Epub 2011 Mar 14. Mol Cell Biol. 2011. PMID: 21402779 Free PMC article.
-
Dissecting the novel partners of nuclear c-Raf and its role in all-trans retinoic acid (ATRA)-induced myeloblastic leukemia cells differentiation.Exp Cell Res. 2020 Sep 1;394(1):111989. doi: 10.1016/j.yexcr.2020.111989. Epub 2020 Apr 10. Exp Cell Res. 2020. PMID: 32283065 Free PMC article.
-
Retinoic acid and 6-formylindolo(3,2-b)carbazole (FICZ) combination therapy reveals putative targets for enhancing response in non-APL AML.Leuk Lymphoma. 2019 Jul;60(7):1697-1708. doi: 10.1080/10428194.2018.1543880. Epub 2018 Dec 20. Leuk Lymphoma. 2019. PMID: 30570341 Free PMC article.
References
-
- Wang ZY, Chen Z. Differentiation and apoptosis induction therapy in acute promyelocytic leukaemia. The lancet oncology. 2000;1:101–106. - PubMed
-
- Wang J, Yen A. A MAPK-positive Feedback Mechanism for BLR1 Signaling Propels Retinoic Acid-triggered Differentiation and Cell Cycle Arrest. J Biol Chem. 2008;283:4375–4386. - PubMed
-
- Reiterer G, Yen A. Platelet-derived growth factor receptor regulates myeloid and monocytic differentiation of HL-60 cells. Cancer Res. 2007;67:7765–7772. - PubMed
-
- Yen A, Roberson MS, Varvayanis S, Lee AT. Retinoic acid induced mitogen-activated protein (MAP)/extracellular signal-regulated kinase (ERK) kinase-dependent MAP kinase activation needed to elicit HL-60 cell differentiation and growth arrest. Cancer Res. 1998;58:3163–3172. - PubMed
-
- Yen A, Cherington V, Schaffhausen B, Marks K, Varvayanis S. Transformation-defective polyoma middle T antigen mutants defective in PLCgamma, PI-3, or src kinase activation enhance ERK2 activation and promote retinoic acid-induced, cell differentiation like wild-type middle T. Exp Cell Res. 1999;248:538–551. - PubMed
Publication types
MeSH terms
Substances
Grants and funding
LinkOut - more resources
Full Text Sources
Other Literature Sources
Molecular Biology Databases
Research Materials
Miscellaneous
