

Associations of borderline and low normal ankle-brachial index values with functional decline at 5-year follow-up: the WALCS (Walking and Leg Circulation Study)
- PMID: 19298919
- PMCID: PMC3215766
- DOI: 10.1016/j.jacc.2008.09.063
Associations of borderline and low normal ankle-brachial index values with functional decline at 5-year follow-up: the WALCS (Walking and Leg Circulation Study)
Abstract
Objectives: We studied associations of borderline and low normal ankle-brachial index (ABI) values with functional decline over a 5-year follow-up.
Background: The associations of borderline and low normal ABI with functional decline are unknown.
Methods: The 666 participants included 412 with peripheral arterial disease (PAD). Participants were categorized as follows: severe PAD (ABI <0.50), moderate PAD (ABI 0.50 to 0.69), mild PAD (ABI 0.70 to 0.89), borderline ABI (0.90 to 0.99), low normal ABI (1.00 to 1.09), and normal ABI (ABI 1.10 to 1.30). Outcomes were assessed annually for 5 years. Mobility loss was defined as loss of the ability to walk one-quarter mile or walk up and down 1 flight of stairs without assistance among participants without baseline mobility impairment. Becoming unable to walk for 6 min continuously was defined as stopping during the 6-min walk at follow-up among those who walked for 6 min continuously at baseline. Results were adjusted for age, sex, race, comorbidities, and other confounders.
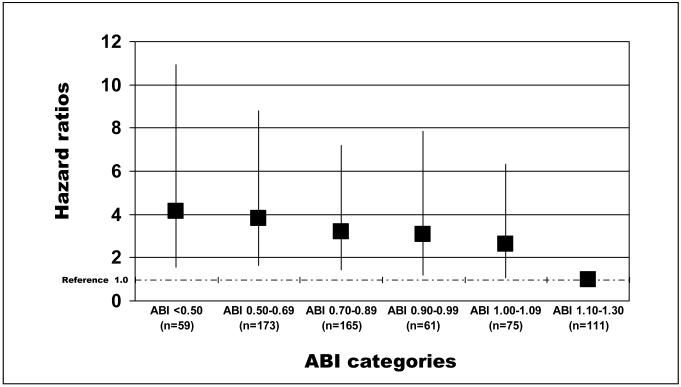
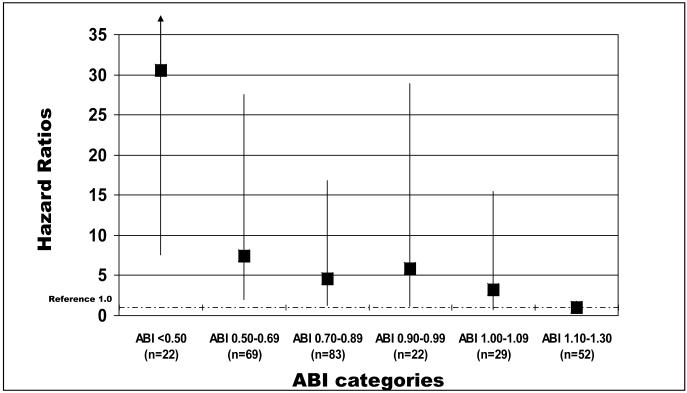
Results: Hazard ratios (HRs) for mobility loss according to ABI category were as follows: severe PAD, HR: 4.16 (95% confidence interval [CI]: 1.58 to 10.92); moderate PAD, HR: 3.82 (95% CI: 1.66 to 8.81); mild PAD, HR: 3.22 (95% CI: 1.43 to 7.21); borderline ABI, HR: 3.07 (95% CI: 1.21 to 7.84); and low normal ABI, HR: 2.61 (95% CI: 1.08 to 6.32; p trend = 0.0018). Similar associations were observed for becoming unable to walk for 6 min continuously (p trend < 0.0001).
Conclusions: At 5-year follow-up, persons with borderline ABI values have a higher incidence of mobility loss and becoming unable to walk for 6 min continuously compared with persons who have a normal baseline ABI. A low normal ABI is associated with an increased incidence of mobility loss compared with persons who have a normal ABI.
Figures
Comment in
-
Rethinking the morbidity of peripheral arterial disease and the "normal" ankle-brachial index.J Am Coll Cardiol. 2009 Mar 24;53(12):1063-4. doi: 10.1016/j.jacc.2008.12.019. J Am Coll Cardiol. 2009. PMID: 19298920 No abstract available.
References
-
- Rosamand W, Flegal K, Friday G, et al. Heart disease and stroke statistics- 2007 update: A report from the American Heart Association Statistics Committee and Stroke Statistics Subcommittee. Circulation. 2007;115(5):e69–171. - PubMed
-
- Allison MA, Hoe E, Denenberg JO, et al. Ethnic-specific prevalence of peripheral arterial disease in the United States. Am J Prev Med. 2007;32:328–333. - PubMed
-
- Hirsch AT, Criqui MH, Treat-Jacobson D, et al. Peripheral arterial disease detection, awareness, and treatment in primary care. JAMA. 2001;286:1317–24. - PubMed
-
- McDermott MM, Liu K, Criqui MH, et al. Ankle-brachial index and subclinical cardiac and carotid disease: The multi-ethnic study of atherosclerosis. Am J Epidemiol. 2005;162:33–41. - PubMed
Publication types
MeSH terms
Grants and funding
LinkOut - more resources
Full Text Sources
