

Distinct genetic influences on cortical surface area and cortical thickness
- PMID: 19299253
- PMCID: PMC2758684
- DOI: 10.1093/cercor/bhp026
Distinct genetic influences on cortical surface area and cortical thickness
Abstract
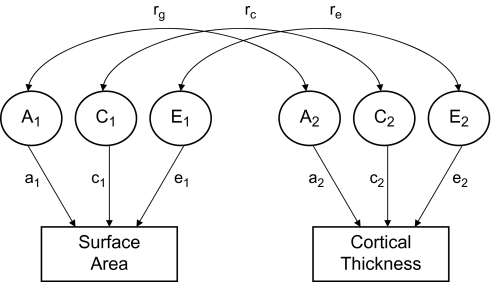
Neuroimaging studies examining the effects of aging and neuropsychiatric disorders on the cerebral cortex have largely been based on measures of cortical volume. Given that cortical volume is a product of thickness and surface area, it is plausible that measures of volume capture at least 2 distinct sets of genetic influences. The present study aims to examine the genetic relationships between measures of cortical surface area and thickness. Participants were men in the Vietnam Era Twin Study of Aging (110 monozygotic pairs and 92 dizygotic pairs). Mean age was 55.8 years (range: 51-59). Bivariate twin analyses were utilized in order to estimate the heritability of cortical surface area and thickness, as well as their degree of genetic overlap. Total cortical surface area and average cortical thickness were both highly heritable (0.89 and 0.81, respectively) but were essentially unrelated genetically (genetic correlation = 0.08). This pattern was similar at the lobar and regional levels of analysis. These results demonstrate that cortical volume measures combine at least 2 distinct sources of genetic influences. We conclude that using volume in a genetically informative study, or as an endophenotype for a disorder, may confound the underlying genetic architecture of brain structure.
Figures
References
-
- Bishop KM, Goudreau G, O'Leary DD. Regulation of area identity in the mammalian neocortex by Emx2 and Pax6. Science. 2000;288:344–349. - PubMed
-
- Carmelli D, Swan GE, DeCarli C, Reed T. Quantitative genetic modeling of regional brain volumes and cognitive performance in older male twins. Biol Psychol. 2002;61:139–155. - PubMed
-
- Dale AM, Fischl B, Sereno MI. Cortical surface-based analysis. I: segmentation and surface reconstruction. Neuroimage. 1999;9:179–194. - PubMed
-
- Desikan RS, Segonne F, Fischl B, Quinn BT, Dickerson BC, Blacker D, Buckner RL, Dale AM, Maguire RP, Hyman BT, et al. An automated labeling system for subdividing the human cerebral cortex on MRI scans into gyral based regions of interest. Neuroimage. 2006;31:968–980. - PubMed
Publication types
MeSH terms
Grants and funding
LinkOut - more resources
Full Text Sources
Other Literature Sources
