

Regulation of sterol regulatory element-binding transcription factor 1a by human chorionic gonadotropin and insulin in cultured rat theca-interstitial cells
- PMID: 19299314
- PMCID: PMC2849815
- DOI: 10.1095/biolreprod.108.074351
Regulation of sterol regulatory element-binding transcription factor 1a by human chorionic gonadotropin and insulin in cultured rat theca-interstitial cells
Abstract
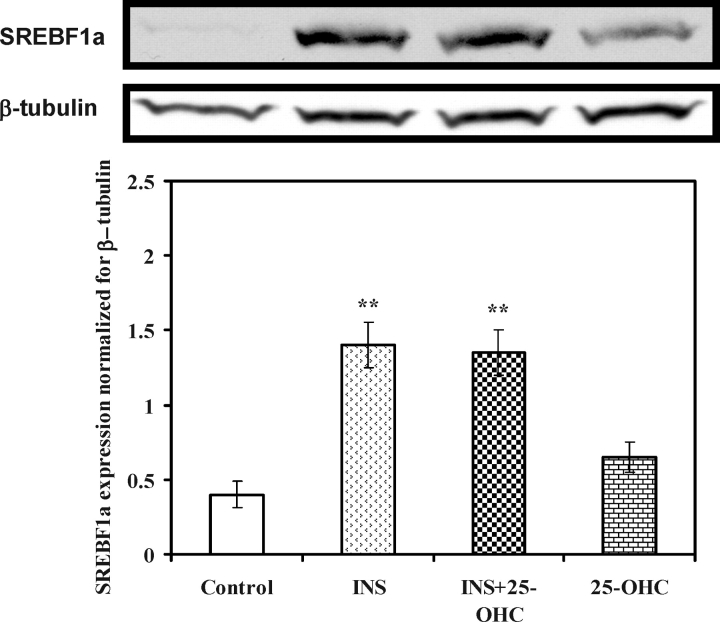
Theca-interstitial (T-I) cells of the ovary synthesize androgens in response to luteinizing hormone (LH). In pathological conditions such as polycystic ovarian syndrome, T-I cells are hyperactive in androgen production in response to LH and insulin. Because cholesterol is an essential substrate for androgen production, we examined the effect of human chorionic gonadotropin (hCG) and insulin on signaling pathways that are known to increase cholesterol accumulation in steroidogenic cells. Specifically, the effect of hCG and insulin on sterol regulatory element-binding transcription factor 1a (SREBF1a) required for cholesterol biosynthesis and uptake was examined. Primary cultures of T-I cells isolated from 25-day-old rat ovaries responded to hCG and insulin to increase the active/processed form of SREBF1a. The hCG and insulin significantly reduced insulin-induced gene 1 (INSIG1) protein, a negative regulator of SREBF processing. Furthermore, an increase in the expression of selected SREBF target genes, 3-hydroxy-3-methylglutaryl-coenzyme A reductase (Hmgcr) and mevalonate kinase (Mvk), was also observed. Protein kinase A (PRKA) inhibitor completely abolished the hCG-induced increase in SREBF1a, while increasing INSIG1. Although the hCG-induced depletion of total and free cholesterol was abolished by aminoglutethimide, the stimulatory effect on SREBF1a was not totally suppressed. Treatment with 25-hydroxycholesterol abrogated the effect of hCG on SREBF1a. Inhibition of the phosphatidylinositol 3-kinase pathway did not block the insulin-induced increase in SREBF1a, whereas mitogen-activated protein kinase inhibition reduced the insulin response. These results suggest that the increased androgen biosynthesis by T-I cells in response to hCG and insulin is regulated, at least in part, by increasing the expression of sterol response element-responsive genes by increasing SREBF1a.
Figures


Similar articles
-
Luteinizing hormone/human chorionic gonadotropin-mediated activation of mTORC1 signaling is required for androgen synthesis by theca-interstitial cells.Mol Endocrinol. 2012 Oct;26(10):1732-42. doi: 10.1210/me.2012-1106. Epub 2012 Jul 24. Mol Endocrinol. 2012. PMID: 22827930 Free PMC article.
-
Regulation of high density lipoprotein receptor messenger ribonucleic acid expression and cholesterol transport in theca-interstitial cells by insulin and human chorionic gonadotropin.Endocrinology. 2001 Jan;142(1):174-81. doi: 10.1210/endo.142.1.7865. Endocrinology. 2001. PMID: 11145580
-
LH/hCG-stimulated androgen production and selective HDL-cholesterol transport are inhibited by a dominant-negative CREB construct in primary cultures of rat theca-interstitial cells.Endocrine. 2005 Aug;27(3):269-77. doi: 10.1385/ENDO:27:3:269. Endocrine. 2005. PMID: 16230783
-
Hormonal regulation of androgen production by the Leydig cell.J Steroid Biochem. 1984 Jan;20(1):161-73. doi: 10.1016/0022-4731(84)90203-6. J Steroid Biochem. 1984. PMID: 6323862 Review.
-
Molecular regulation of gonadotropin receptor expression: relationship to sterol metabolism.Mol Cell Endocrinol. 2010 Nov 25;329(1-2):26-32. doi: 10.1016/j.mce.2010.05.014. Epub 2010 Jun 4. Mol Cell Endocrinol. 2010. PMID: 20570710 Free PMC article. Review.
Cited by
-
The liver X receptors and sterol regulatory element binding proteins alter progesterone secretion and are regulated by human chorionic gonadotropin in human luteinized granulosa cells.Mol Cell Endocrinol. 2018 Sep 15;473:124-135. doi: 10.1016/j.mce.2018.01.011. Epub 2018 Jan 31. Mol Cell Endocrinol. 2018. PMID: 29366778 Free PMC article.
-
Regulation of LH receptor mRNA binding protein by miR-122 in rat ovaries.Endocrinology. 2013 Dec;154(12):4826-34. doi: 10.1210/en.2013-1619. Epub 2013 Sep 24. Endocrinology. 2013. PMID: 24064360 Free PMC article.
-
Luteinizing hormone/human chorionic gonadotropin-mediated activation of mTORC1 signaling is required for androgen synthesis by theca-interstitial cells.Mol Endocrinol. 2012 Oct;26(10):1732-42. doi: 10.1210/me.2012-1106. Epub 2012 Jul 24. Mol Endocrinol. 2012. PMID: 22827930 Free PMC article.
-
Human chorionic gonadotropin stimulates theca-interstitial cell proliferation and cell cycle regulatory proteins by a cAMP-dependent activation of AKT/mTORC1 signaling pathway.Mol Endocrinol. 2010 Sep;24(9):1782-93. doi: 10.1210/me.2010-0044. Epub 2010 Jul 21. Mol Endocrinol. 2010. PMID: 20660299 Free PMC article.
-
Metformin: direct inhibition of rat ovarian theca-interstitial cell proliferation.Fertil Steril. 2012 Jul;98(1):207-14. doi: 10.1016/j.fertnstert.2012.04.010. Epub 2012 May 17. Fertil Steril. 2012. PMID: 22608319 Free PMC article.
References
-
- Barbieri R.Polycystic ovarian disease. Annu Rev Med 1991; 42: 199–204. - PubMed
-
- Dunaif A, Thomas A.Current concepts in the polycystic ovary syndrome. Annu Rev Med 2001; 52: 401–419. - PubMed
-
- Magoffin DA.The ovarian androgen-producing cells: a 2001 perspective. Rev Endocr Metab Disord 2002; 3: 47–53. - PubMed
-
- Azziz R.Androgen excess is the key element in polycystic ovary syndrome. Fertil Steril 2003; 80: 252–254. - PubMed
-
- Cara JF, Rosenfield RL.Insulin-like growth factor I and insulin potentiate luteinizing hormone-induced androgen synthesis by rat ovarian thecal-interstitial cells. Endocrinology 1988; 123: 733–739. - PubMed
Publication types
MeSH terms
Substances
Grants and funding
LinkOut - more resources
Full Text Sources
Medical
Molecular Biology Databases
