. 2009 Jul;150(7):3049-57.
doi: 10.1210/en.2008-0913. Epub 2009 Mar 19.

Perilipin is present in islets of Langerhans and protects against lipotoxicity when overexpressed in the beta-cell line INS-1

Affiliations

Perilipin is present in islets of Langerhans and protects against lipotoxicity when overexpressed in the beta-cell line INS-1

Jörgen Borg et al. Endocrinology. 2009 Jul.

Abstract

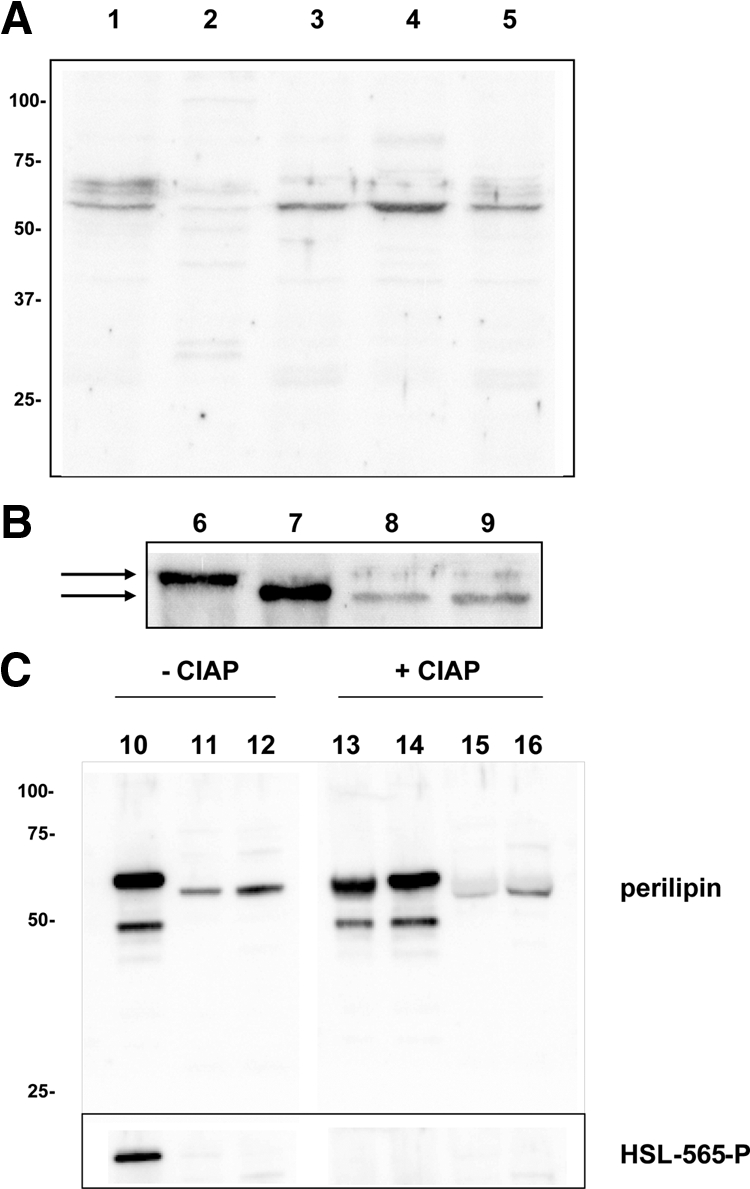
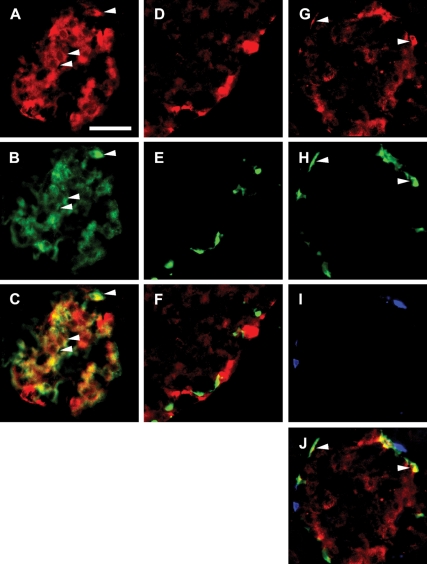
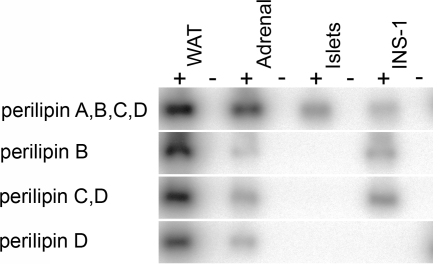
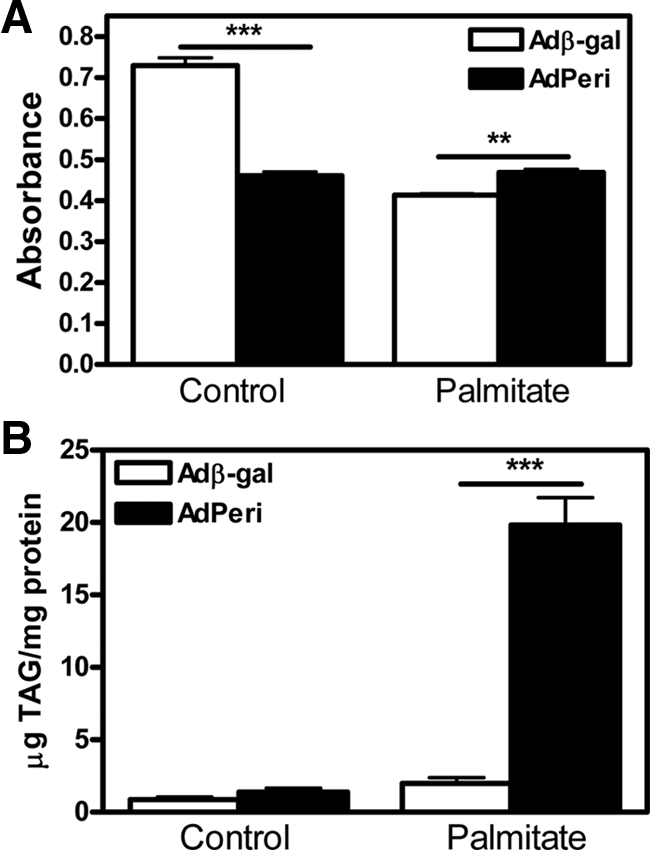
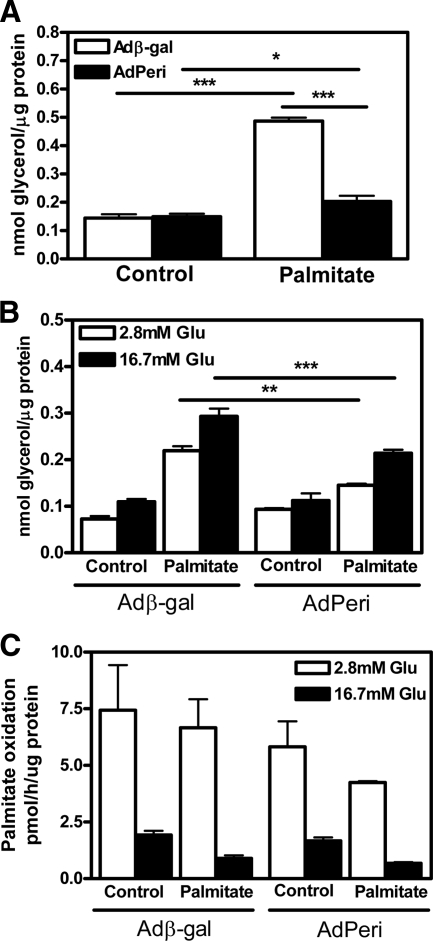
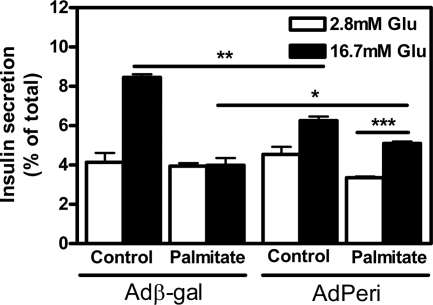
Lipids have been shown to play a dual role in pancreatic beta-cells: a lipid-derived signal appears to be necessary for glucose-stimulated insulin secretion, whereas lipid accumulation causes impaired insulin secretion and apoptosis. The ability of the protein perilipin to regulate lipolysis prompted an investigation of the presence of perilipin in the islets of Langerhans. In this study evidence is presented for perilipin expression in rat, mouse, and human islets of Langerhans as well as the rat clonal beta-cell line INS-1. In rat and mouse islets, perilipin was verified to be present in beta-cells. To examine whether the development of lipotoxicity could be prevented by manipulating the conditions for lipid storage in the beta-cell, INS-1 cells with adenoviral-mediated overexpression of perilipin were exposed to lipotoxic conditions for 72 h. In cells exposed to palmitate, perilipin overexpression caused increased accumulation of triacylglycerols and decreased lipolysis compared with control cells. Whereas glucose-stimulated insulin secretion was retained after palmitate exposure in cells overexpressing perilipin, it was completely abolished in control beta-cells. Thus, overexpression of perilipin appears to confer protection against the development of beta-cell dysfunction after prolonged exposure to palmitate by promoting lipid storage and limiting lipolysis.


Figures

Figure 1
Figure 1
INS-1 cells express perilipin protein. A, Western blot analysis for perilipin after fractionation of INS-1 cells. Twenty micrograms of protein were loaded in each lane. Lane 1, INS-1 crude homogenate; lane 2, supernatant after 1 h of centrifugation at 100,000 × g; lane 3, the pellet to the supernatant in lane 2; lane 4, supernatant after detergent solubilization of the pellet from lane 3 and subsequent centrifugation; lane 5, the pellet to the supernatant in lane 4. B, Western blot analysis for perilipin in rat WAT, rat pancreatic islets, and INS-1 cells. Four micrograms of total protein were loaded in lanes 6 and 7 and 20 μg in lane 8 and 9. Lane 6, Visceral WAT; lane 7, INS-1 cells overexpressing perilipin A; lane 8, detergent-solubilized supernatant from homogenized and fractionated pancreatic islets; lane 9: detergent-solubilized supernatant from homogenized and fractionated INS-1 cells. The arrows indicate the difference in apparent molecular size observed between perilipin from WAT and islet cells. C, Western blot analysis for perilipin and for Ser-565 phosphorylated HSL in rat WAT, rat pancreatic islets, and INS-1 cells after treatment or not with calf intestinal alkaline phosphatase (CIAP). A homogenate of WAT corresponding to 2 μg of total protein was treated with either 10 U (lane 13; 5 U/μg protein; 0.1 U/μl) or 2 U CIAP (lane 14; 1 U/μg protein; 0.02 U/μl) and homogenates of islets (lane 15) and INS-1 cells (lane 16) corresponding to 10 μg of total protein were treated with 10 U CIAP (1 U/μg protein; 0.1 U/μl) and analyzed together with samples not treated with CIAP (lane 10, WAT; lane 14, rat islets; lane 15, INS-1 cells) by Western blot. To confirm the efficiency of the CIAP treatment, the blot was also probed with a phosphospecific HSL antibody, which recognized Ser-565 phosphorylation on HSL in WAT in samples not treated with CIAP but not in CIAP-treated samples. HSL expression in islets and INS-1 cells was not detected using this antibody.
Figure 2
Figure 2
Perilipin is expressed in β-cells and α-cells of rat islets of Langerhans. Fluorescence photomicrographs of double- and triple-immunostained rat islets. A, Staining for perilipin (red). B, Staining for insulin (green). C, Merged image of A and B, demonstrating that the majority of the islet β-cells harbor perilipin. Arrowheads exemplify colocalization (yellow) of perilipin and insulin. D, Staining for perilipin (red). E, Staining for somatostatin (green). F, Merged image of D and E demonstrating that islet δ-cells are devoid of perilipin. Staining for perilipin (G; red), glucagon (H; green), and PP (I; blue) is shown. J, Merged image of G–I demonstrating that perilipin is not present in PP cells but is expressed in a subpopulation of α-cells. Colocalization of perilipin and glucagon (yellow) is exemplified by arrowheads. Scale bar (A, valid for A–J), 50 μm. Details of staining procedure and antibodies used are given in Materials and Methods and Table 1, respectively.
Figure 3
Figure 3
Perilipin is expressed in β-cells of wild-type mouse islets (A–C) but lacking in islets of perilipin knockout mice (D–F). Fluorescence photomicrographs of islets double immunostained for perilipin (green; A and D) and insulin (red; B and E), merged in C and F. Arrowheads exemplify colocalization (yellow) of perilipin and insulin. Scale bar (A, valid for A–F), 50 μm.
Figure 4
Figure 4
Perilipin mRNA pattern in rat islets of Langerhans and INS-1 cells. Southern blot performed on amplified DNA derived from RT-PCR performed on RNA isolated from WAT, adrenals, islets of Langerhans, and INS-1 cells with primers designed to amplify the sequences from the different perilipin mRNAs as indicated. Detection was performed with two different probes complementary to shorter internal sequences of the different perilipin isoforms. Negative controls were included for all samples (−) and show no DNA amplification.
Figure 5
Figure 5
Impact of perilipin overexpression on cell proliferation rate (A) and cellular TAG stores (B). INS-1 cells were infected with Adperi or Adβ-gal virus (control) and preincubated for 72 h with or without palmitate in the presence of 16.7 mm glucose. Cell proliferation rate (A) was measured using a commercially available assay and TAG content (B) was measured after Folch extraction. Data shown are mean ± sem (n = 8 in A and n = 4 in B). *, P < 0.05; **, P < 0.01; ***, P < 0.001.
Figure 6
Figure 6
Overexpression of perilipin decreases lipolysis in INS-1 cells but has no effect on fatty acid oxidation. A, Determination of basal lipolytic activity (release of glycerol). INS-1 cells were infected with Adperi or Adβ-gal virus (control) and preincubated for 72 h with or without palmitate in the presence of 16.7 mm glucose. Basal lipolysis was subsequently determined during 2 h of incubation in serum-free medium under nonstimulatory conditions (2.8 mm glucose). Data shown are mean ± sem (n = 12). B, After determination of basal lipolysis, the lipolytic activity during acute stimulation with glucose (Glu) was determined. The Adperi- and Adβ-gal-infected cells were incubated for an additional hour in KRB containing low (2.8 mm) or high (16.7 mm) glucose and the amount of glycerol released into the cell culture medium was determined. Data shown are mean ± sem (n = 8). C, Palmitate oxidation was measured under the same experimental conditions as under A and B. Data shown are mean ± sem (n = 3). *, P < 0.05; **, P < 0.01; ***, P < 0.001.
Figure 7
Figure 7
INS-1 cells overexpressing perilipin are protected against lipotoxicity. INS-1 cells were infected and incubated for 72 h with or without 0.75 mm palmitate in the presence of 16.7 mm glucose (Glu; for more details, see Materials and Methods). Insulin secretion was thereafter measured during 60 min at low (2.8 mm) or high glucose (16.7 mm) conditions and related to insulin content. Data shown are mean ± sem (n = 4). *, P < 0.05; **, P < 0.01; ***, P < 0.001.

References

    1. Henquin JC 2000 Triggering and amplifying pathways of regulation of insulin secretion by glucose. Diabetes 49:1751–1760 - PubMed
    1. Mulder H, Yang S, Winzell MS, Holm C, Ahrén B 2004 Inhibition of lipase activity and lipolysis in rat islets reduces insulin secretion. Diabetes 53:122–128 - PubMed
    1. Stein DT, Esser V, Stevenson BE, Lane KE, Whiteside JH, Daniels MB, Chen S, McGarry JD 1996 Essentiality of circulating fatty acids for glucose-stimulated insulin secretion in the fasted rat. J Clin Invest 97:2728–2735 - PMC - PubMed
    1. Koyama K, Chen G, Wang MY, Lee Y, Shimabukuro M, Newgard CB, Unger RH 1997 β-Cell function in normal rats made chronically hyperleptinemic by adenovirus-leptin gene therapy. Diabetes 46:1276–1280 - PubMed
    1. Masiello P, Novelli M, Bombara M, Fierabracci V, Vittorini S, Prentki M, Bergamini E 2002 The antilipolytic agent 3,5-dimethylpyrazole inhibits insulin release in response to both nutrient secretagogues and cyclic adenosine monophosphate agonists in isolated rat islets. Metabolism 51:110–114 - PubMed

Publication types